We often get questions about the kind of hardware requirements needed for a particular Nagios installation. As covered in a previous article, this is often a very difficult question to answer since monitoring environments differ so much. Most people assume that for a large Nagios installation, it’s a matter of simply adding enough CPU’s to the machine to handle the workload that it’s given. Although having enough CPU power is important, I’ve found that it’s ultimately not the biggest hardware limitation to the system. A large Nagios installation creates an enormous amount of disk activity, and if the hard disk can’t keep up with the constant traffic flow that needs to happen, all of those precious CPU’s are simply going to wait in line to be able to do what they need to do on the system. I’ve talked to some users who have spent some serious money on hardware to have insanely fast disks to handle their workload, but I wanted to do some experiments in-house for those users who may need to have better performance on a budget. I want to give special thanks to Nagios community members Dan Wittenberg and Max Schubert for documenting some of the tricks that you guys pioneered on this topic.
Lets look at some of the key files that create disk activity on a Nagios install. The examples below match a typical source install of Nagios Core, and any vanilla Nagios XI install.
/usr/local/nagios/var/status.dat – This is the bread and butter file of all of the “live” information on the monitoring environment. This file gets updated every 10-20 seconds (as specified in nagios.cfg) with all current status information.
/usr/local/nagios/var/objects.cache – This file stores all of the object configuration data for Nagios. This file only gets updated upon a restart of the Nagios process.
/usr/local/nagios/var/host-perfdata && service-perfdata – These files may be in a different location for Core install, but this file functions as an intermediary file for PNP’s NPCD daemon that processes performance data results. This file gets updated about every 10-15 seconds.
/usr/local/nagios/var/spool – This directory tree acts as a dropbox for all incoming check results. The disk activity in this directory is almost constant, since both Nagios and NPCD are continually creating result files, and then reaping the results every X number of seconds.
/usr/local/nagios/var/*.log – I thought the log files were worth mentioning. Logging takes both CPU and disk activity, so minimize all unnecessary logging if you need to scale.
Test Case: My old desktop workstation as an XI Server. This machine is not especially powerful, but one of my side projects is seeing how much I can load it up purely with configuration changes:
Nagios XI Server .
- Intel Dual Core CPU 3gz
- 2gb of RAM
- 140gb SATA HD, probably 7200 RPM
- Offloaded MySQL to a VM with 1gb of RAM, and a single CPU
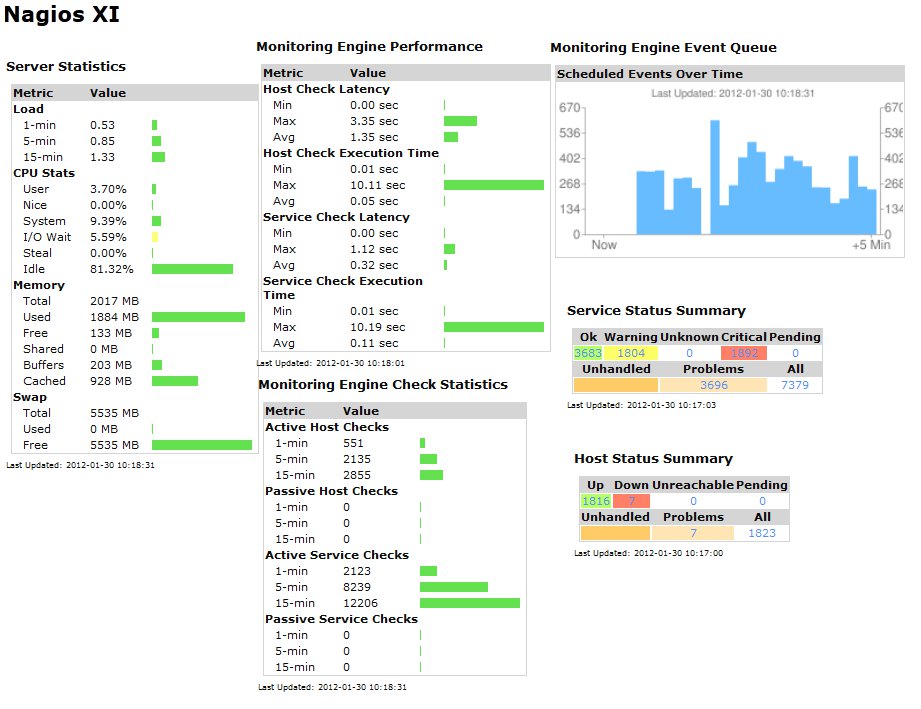
- 1823 Hosts, 7379 Services. All active checks running on a 5mn check interval.
- 9202 checks in 5mn
- Around 40 checks per second
- All active checks are being executed from the XI server, mostly running PING, HTTP, DNS To IP, and DNS Resolution
Pre-Existing Tweaks:
- Offloaded MySQL to a 2nd machine
- RAM Disk for status.dat and object.cache
- rrdcached in use
- Minimal Logging
- Minimized Notifications – Don’t send more notifications than you need to. This holds up the main Nagios execution loop and uses more CPU.
The Problem:
- In this experiment I started with around 5000 checks, and tried increasing to around 8000. I found that the CPU load was will fine (around 2.0), but my host and service latencies were continually growing with time, and Nagios couldn’t maintain the check schedule. This wasn’t an overtaxing of the CPU, but Nagios simply couldn’t write information to the disk fast enough to keep up with the check schedule. It was essentially constantly waiting in line to access the disk.
The Solution:
- Although this won’t work for every environment, I basically moved every file with constant disk activity to the RAM disk. The danger of this is that if the server experienced a hard power-down, then all of those check results and performance data results would get lost. However, if your monitoring server has a hard shutdown, you’ve probably got bigger problems than just a few lost check results.
- All performance data and check results in the spool directory are now written to the RAM disk, as well as the intermediary perfdata files.
|
1 |
ll /var/ramdisk |
|
1 2 3 4 5 6 7 8 9 10 11 12 13 |
total 19264 -rw-rw-r-- 1 nagios users 16646 Jan 30 11:35 host-perfdata -rw-r--r-- 1 nagios nagios 7070305 Jan 19 15:56 objects.cache -rw-rw-r-- 1 nagios users 106435 Jan 30 11:35 service-perfdata drwxrwxrwx 4 nagios nagios 4096 Jan 19 15:11 spool -rw-rw-r-- 1 nagios users 12487278 Jan 30 11:35 status.dat ll /var/ramdisk/spool total 100 drwxrwxrwx 2 root root 86016 Jan 30 11:36 checkresults drwxrwxrwx 2 root root 12288 Jan 30 11:36 perfdata In order to set this up properly, I had to modify my main nagios.cfg file, as well as some of my command definitions. |
/usr/local/nagios/etc/nagios.cfg Modifications:
|
1 2 |
host_perfdata_file=/var/ramdisk/host-perfdata host_perfdata_file=/var/ramdisk/host-perfdata |
|
1 |
object_cache_file=/var/ramdisk/objects.cache |
|
1 |
check_result_path=/var/ramdisk/spool/checkresults |
|
1 |
status_file=/var/ramdisk/status.dat |
/usr/local/nagios/etc/pnp/npcd.cfg Modifications:
|
1 |
perfdata_spool_dir = /var/ramdisk/spool/perfdata/ |
Modified Nagios XI Command Definitions:
|
1 2 3 4 5 6 7 8 9 10 11 12 13 14 15 16 17 18 19 |
define command { command_name process-host-perfdata-file-bulk command_line /bin/mv /var/ramdisk/host-perfdata /var/ramdisk/spool/perfdata/$TIMET$.perfdata.host } define command { command_name process-host-perfdata-file-pnp-bulk command_line /bin/mv /var/ramdisk/host-perfdata /var/ramdisk/spool/perfdata/host-perfdata.$TIMET$ } define command { command_name process-service-perfdata-file-bulk command_line /bin/mv /var/ramdisk/service-perfdata /var/ramdisk/spool/perfdata/$TIMET$.perfdata.service } define command { command_name process-service-perfdata-file-pnp-bulk command_line /bin/mv /var/ramdisk/service-perfdata /var/ramdisk/spool/perfdata/service-perfdata.$TIMET$ } |
For some long time Core users, this may not be new information. But what I’ve found in researching this topic is that a lot of people have done modifications to their system like this, but there is very little public documentation on how people actually did it. I’m hoping this information will be useful to some users and maybe even save somebody some money on hardware. : )
|
1 |
<a href="http://labs.nagios.com/wp-content/uploads/2012/01/benchdiskio.jpg"><img class="aligncenter wp-image-390" title="benchdiskio" src="https://labs.nagios.com/wp-content/uploads/2012/01/benchdiskio.jpg" alt="" width="682" height="336" /></a> |


Do you have any graphs of host load and check latency spanning before and after these changes were implemented, so people can get a sense of what percentage performance improvement you saw from this?
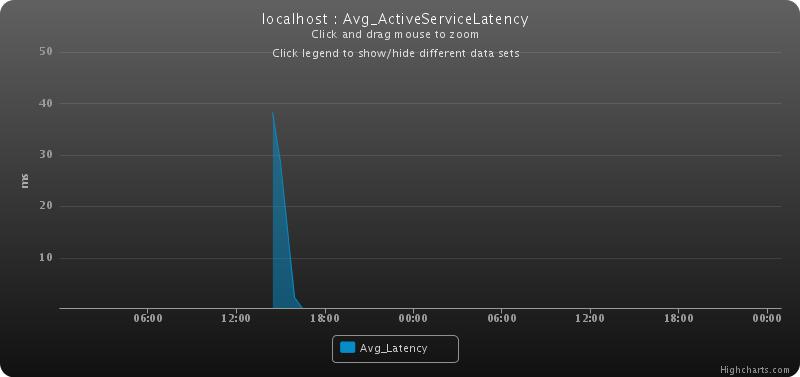
I added graphs for the service latency and Disk Write activity. Unfortunately I didn’t have the server running steadily before I implemented the new changes, so I don’t have a good graph for before and after on CPU, although differences on that weren’t that noticeable. From what I can tell is that system-level processes like kjournald cause the overall CPU load to ebb and flow between 1.0 and 6.0 every couple of hours. I’ve seen that pattern throughout all of the benchmarking stages I’ve done so far.
I’d also be very curious to see the results of offloading performance graph processing entirely, both for disk and CPU, as well as the easier ceck of just putting the grap files on a separate physical disk or NFS share.
When I talked to some of the guys at the NWC who have large implementations, most of them were using rrdcached, but I don’t think they were actually moving perf data processing to their own servers, at least not for one of the guys that I talked to with a very large environment. It seemed like his suggestion was “get the fastest disks you can afford, and lots of CPU’s to split up the processing.” rrdcached is socket-based, so it can go across multiple machines, but I know there has been talk of security concerns doing that.