Tag Archive for 'Nagios Exchange'

Heartbleed: One Bug to Rule Them All

If you’ve missed the news in the last few days, OpenSSL has been found to contain a rather large issue in it’s implementation of TLSv1.1 and TLS1.2 for versions 1.0.1 through 1.0.1f and 1.0.2-beta. Thankfully, no other versions contain this issue and due to responsible disclosure, a patch is already available in the form of OpenSSL 1.0.1g, which many distributions are already making available via standard package management, such as yum and apt.

As for the juicy details… Heartbleed is a vulnerability caused by a missing bounds check and lack of validation, with the TLS heartbeat extension, that allows for up to 64k of memory to be leaked to an attacker. This is done via initializing a TLS connection over TCP or UDP. When this connection is begun, a heartbeat is shared between the client and server to validate that they are both in good working order. If a malformed, specifically empty, heartbeat is sent, the responding client or server will attempt to copy memory from a packet that is not available and instead respond with data that was previously at the same location that the packet should have been located in memory on the victim’s system. The process is not limited to a newly initialized connection and may be repeated at any point in time with existing connections as well. This could result in leaked memory containing rather benign large chunks of empty memory or severe issues such as private encryption keys, session id’s, passwords, and anything else that might be in the victim’s memory.

Just to clarify, this can affect both clients and servers. Yes, your Android phone’s web browser is just as affected as your Apache web server or OpenLDAP server. So, while updating your OpenSSL version, firmware and operating system are extremely important, one must also consider applications and services that ship with internal versions of OpenSSL or include libraries with compilation that standard updates may not correct.

Resolving this on most systems including current CentOS, RHEL, and Debian based distributions can already be found via standard updates with the included package managers. Systems that do not currently provide updated versions of OpenSSL can be manually updated by building version 1.0.1g from source or building previous versions with the -DOPENSSL_NO_HEARTBEATS flag. In the case of embedded systems such as switches, routers and phones, a firmware update request may have to be made to the vendor directly.

After seeing the large effect this particular bug is having worldwide, we decided to modify existing proof of concept code and provide Nagios users with an automated way to check your systems. Through a Nagios plugin, you can now validate whether your TCP services are vulnerable to the bug with both TLSv1.1 and TLSv1.2. Soon to be implemented updates will include checking of STARTTLS vulnerabilities and UDP connections.

Without further ado, we present the check_heartbleed plugin and heartbleed testing page.

Nagios Exchange: check_heartbleed.py
Nagios.com/heartbleed-tester

Keeping an Eye on Problematic Services with the Status Info Dashlet

The Status Info Dashlet has been available on the Nagios Exchange website for about a year now. It is a very cool dashlet, that in my opinion, doesn’t get the attention it deserves. The Status Info Dashlet allows you to display the current status of a service as a dashlet on a dashboard in nice big numbers, and is especially useful in cases when you want to keep an eye on a problematic service.

Setup and Installation of the Status Info Dashlet is quite easy:

First, you need to download the dashlet from the Nagios Exchange site: Status Info Dashlet
Direct Download Link: statusinfo.zip

Next, add the dashlet from the Nagios XI web interface:
Admin -> System Extensions -> Manage Dashlets -> Browse -> statusinfo.zip -> Open -> Upload Dashlet

Once the dashlet has been successfully installed, you can add it to a dashboard of choice:
Dashboards -> Add Dashlets -> Available Dashlets
and clicking on the “dashify” icon in the upper left corner of the dashlet to add it to a Dashboard .

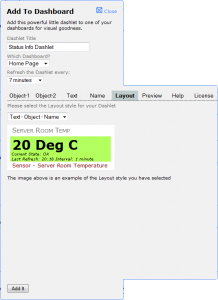
You will see the “Add To Dashboard” interface, which has many different options, allowing you to customize your dashlet. The first three options on the top allow you to set the dashlet’s title, the dashboard, where you would like the dashlet to be added to, and the refresh rate. Below these three options, you will see eight tabs for even more customizations. I will go through each one briefly, and describe the most basic choices.

1) Object-1

Here you can select the object (service), that you want your dashlet to use. You also have an option to show the current service status as text, set the background color, “trim” the output (the beginning or the end), in order to discard the information that you don’t need. You can also show the last refresh time and the refresh interval underneath the object.

2) Object-2

This is NOT a place, where you can select a second object (service) – the name is a bit misleading. Here you can change the object text formatting (text size, weight, style, color, etc.)

3) Text

From here, you can add additional text to your dashlet and style it how you want.

4) Name

The menu allows you to select the name format that you want to appear in the dashlet. The available options are:

– Host
– Host – Service Name
– Service Name
– Service Name – Host

You can also format the text (size, style, color, etc.)

5) Layout

This allows you to select how you want the dashlet displayed. There is a drop-down menu with a various combinations for displaying “Text”, “Object”, and “Name”.

6) Preview

When you click on this tab, you will see a preview of what your dashlet will look like.

7) Help

The help menu explains in details the various options that exist in each section/tab.

8) License

Here you can read the license for this dashlet.

After you selected all of the options you want, just click on the “Add it” button on the bottom. Then you can go to the dashboard, where you added that dashlet and view status info for your service.  You’ve now successfully added the Status Info Dashlet to your Nagios XI views.  It’s as easy as that.