When active agent-based monitoring is not an option (because of a firewall, or security restriction), passive monitoring can provide the solution necessary to maintain network security and health. Today we will be discussing Nagios Remote Data Sender (NRDS) and how it can monitor Linux machines using passive check results. Passive results are sent to the Nagios Remote Data Processor (NRDP) server and processed in Nagios XI.
The NRDS client configuration can be managed centrally via the NRDS Config Manager Component in Nagios XI. Updated configuration files on the NRDS server are automatically picked up by all clients. The NRDS client runs on a cron job at a specified interval. Each time it runs, it will do the following:
- Run all of the commands, specified in the config file
- Send the results back to the Nagios XI server
- Check if there is a new version of the configuration file on the Nagios XI server, and if there is one, it will download it
- Download all of the plugins it needs from the server and install them on the client
In this article, I will show you how you can start monitoring a Linux host passively in three easy steps.
Step 1 – Adding Configuration
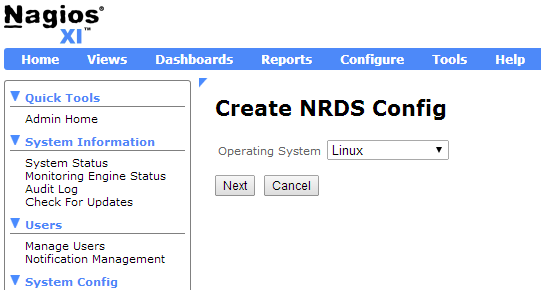
Go to Admin -> Monitoring Config -> NRDS Config Manager, click on Create Config, and select Linux from the Operating System drop-down menu.
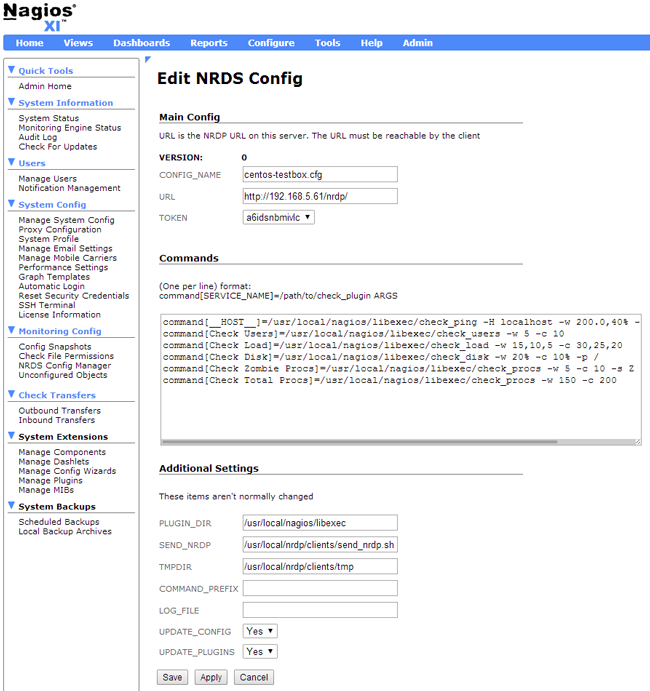
Most of the config options will already be populated for you with the default options. All you will need to do is type a config name, select a token from the drop-down menu, and click on the Apply button. For this example, we will be creating a config called “centos-testbox.cfg.”
For more information on editing configuration files in NRDS, please, watch the video below:
Step 2 – Client Installation
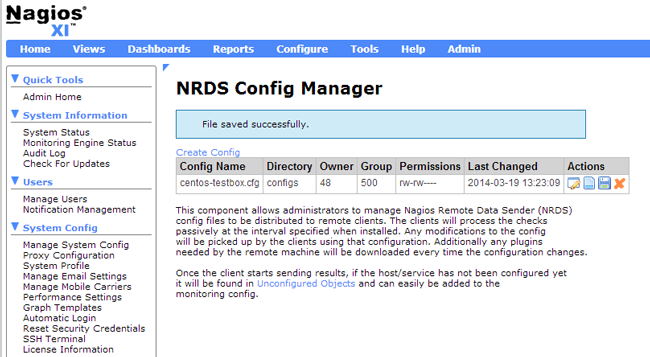
Now we must install the client. Go back to the NRDS Config Manager (Admin -> Monitoring Config -> NRDS Config Manager). You will see the new configuration file, that you just created (in this case it is called centos-testbox.cfg).
Click on the “Client Install Instructions” button (the “Notepad” icon) to view the commands that you need to run on the client.
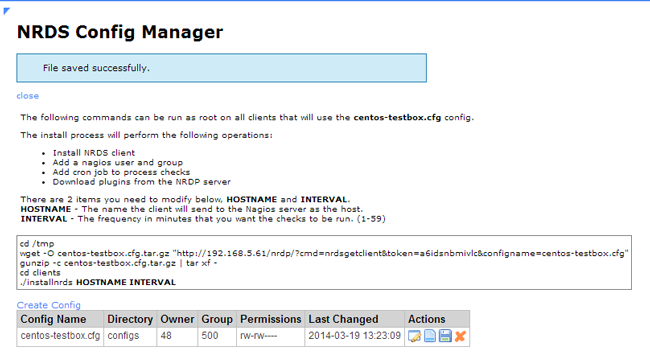
Run the following Client Install Instruction commands from the terminal on the client machine. In the last command you will need to enter the hostname and the time interval you would like to use.
|
1 2 3 4 5 |
cd /tmp wget -O centos-testbox.cfg.tar.gz "http://192.168.0.100/nrdp/?cmd=nrdsgetclient&token=nagios&configname=centos-testbox.cfg" gunzip -c centos-testbox.cfg.tar.gz | tar xf - cd clients ./installnrds CentOSVMx64 5 |
In the output you should see a confirmation that the client was installed.
|
1 2 3 4 5 6 7 8 9 10 11 |
Group nagios does not exist. Creating... User nagios does not exist. Creating... Installing NRDS Client Adding cron jobs for CentOSVMx64 at a 5 minute interval no crontab for nagios Crontabs installed OK Updating config and plugins Updated config to version 0.1 Updated 7 plugins Installation complete |
You can view the crontab entry by running the following command:
|
1 |
crontab -u nagios -l |
Step 3 – Configure The Host And Its Services
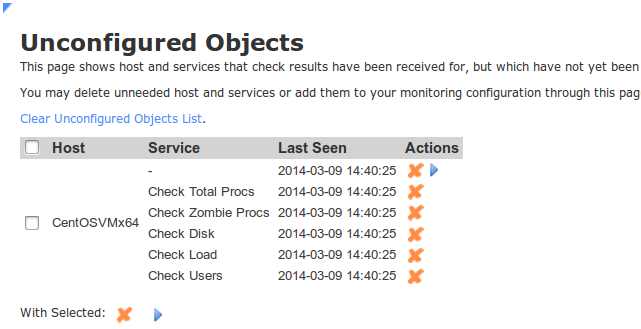
The last step is to configure the host and its services. From the Nagios XI web interface, click on Admin -> Monitoring Config -> Unconfigured Objects.
Select the checkbox next to the host, and click on the Configure button (the blue triangle).
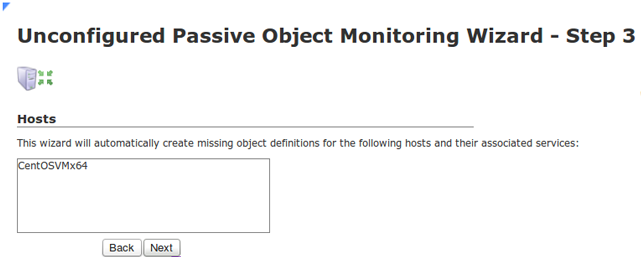
Click on the Next button to proceed and complete the Unconfigured Passive Object Monitoring Wizard.
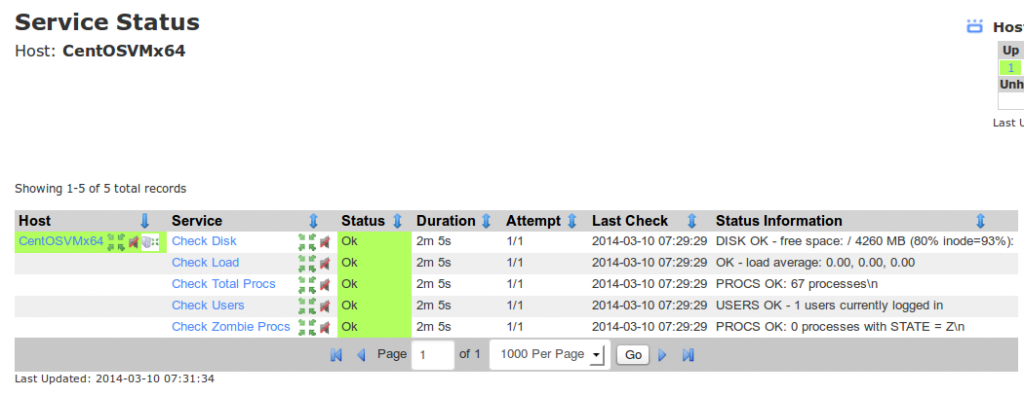
You have now successfully configured a Linux host for passive monitoring with NRDS in Nagios XI. The checks can be viewed in the Service Status Dashboard.
For more information about passive monitoring with Nagios XI and NRDS here:
Passive Monitoring with NRDS and Nagios XI
Watch the the NRDS video tutorial here:
Nagios Remote Data Sender Tutorial
Happy Monitoring!


What about the perf data, graphs?
I see that per data is send (CPU Load).
I did set it up in passive service template, but.. the graphs don’t seem to show up…