Author Archive for Ludmil Miltchev

Page 2 of 5

How to Monitor MySQL Logs with Nagios Log Server

Many times when you run out of disk space on the Nagios XI server or you don’t shut down the VM properly, you end up with crashed tables in the MySQL database. One way to solve this issue is to monitor the mysqld.log for errors, and fix the problems in a timely matter. You can easily achieve this goal by monitoring the MySQL logs via  Nagios Log Server.

In this article, I will show you how to set up MySQL monitoring in Nagios Log Server, how to use simple searches and how to filter the results. Continue reading ‘How to Monitor MySQL Logs with Nagios Log Server’

How to Passively Monitor Windows Machines with NRDS & Nagios XI

In my previous article, I demonstrated how easy it is to passively monitor Linux machines with Nagios Remote Data Sender (NRDS) and Nagios XI. In today’s article, I will cover passive monitoring of Windows machines via NRDS.

Monitoring Windows machines via NRDS is no different than monitoring Linux boxes. You need to follow the same three steps:

  1. Adding Configuration
  2. Client Installation
  3. Configuring the host and its services

Step 1 – Adding Configuration

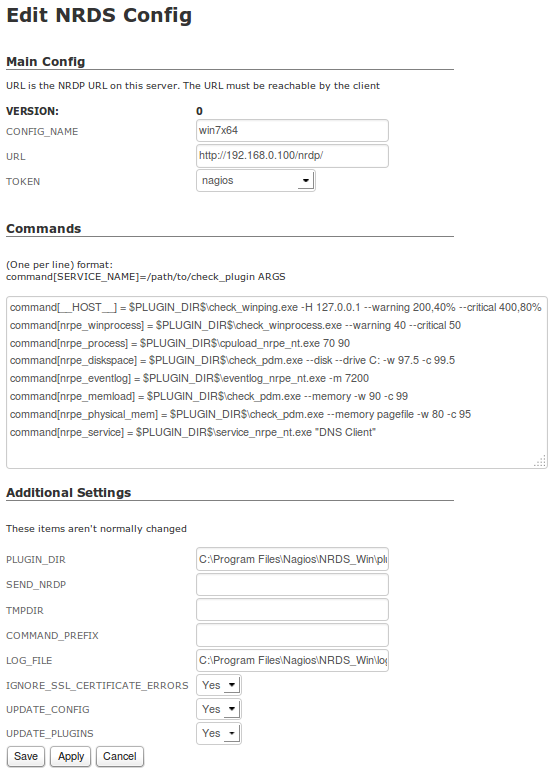
Go to Admin -> Monitoring Config -> NRDS Config Manager, click on Create Config, select Windows (32- or 64-bit) from the Operating System drop-down menu, and click on the Next button. You will see the Edit NRDS Config page. Most of the config options will already be populated for you with the default options. All you will need to do is type a config name, select a token from the drop-down menu, and click on the Apply button. For this example, we will be creating a config called “Win7x64”.

Edit NRDS Config

Continue reading ‘How to Passively Monitor Windows Machines with NRDS & Nagios XI’

How to Add Nagios Network Analyzer Reports in Nagios XI

If you are currently using both Nagios XI and Nagios Network Analyzer, the release of Nagios XI 2014 has made it very easy to add Nagios Network Analyzer reports in XI. All you need to do is to configure the Network Analyzer Component in Nagios XI. Here’s how you do it:

  • From the Nagios XI Web interface, click on the Admin menu, then click on the Manage Components menu.
  • Find the Nagios Network Analyzer Component and click on the Edit Settings button.
  • Click the Add a Server button.
  • Enter the required information, and click Apply Settings.

Nagios Network Analyzer Component Settings

Continue reading ‘How to Add Nagios Network Analyzer Reports in Nagios XI’

Monitoring AKCP sensorProbe2 with Nagios XI Using SNMP

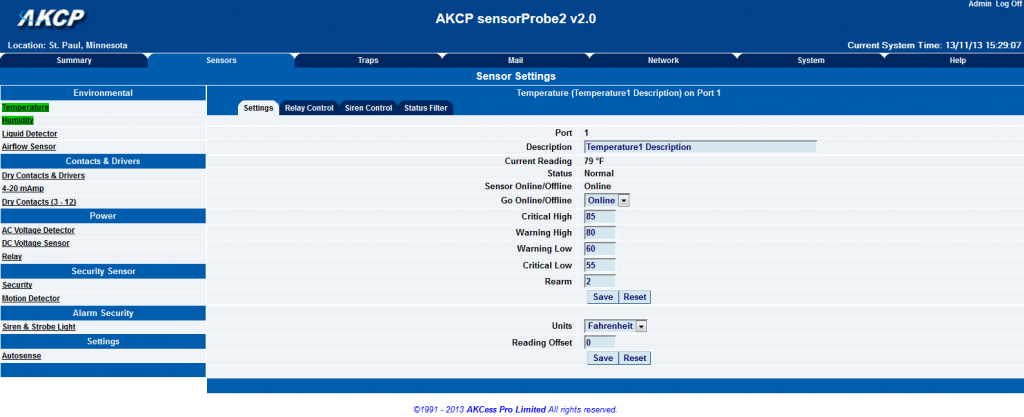
The sensorProbe2, sensorProbe4, sensorProbe8 and Probe8-X20 are intelligent devices for monitoring environmental variables, power, physical threads and security. Various AKCP intelligent sensors can be connected via the RJ45 connectors to the sensorProbe devices.

AKCP sensorProbe2 Web Interface

I would like to show you how easy it is to monitor a Dual Temperature/Humidity AKCP Sensor in Nagios XI via SNMP active checks and SNMP traps.

Continue reading ‘Monitoring AKCP sensorProbe2 with Nagios XI Using SNMP’