Author Archive for Ludmil Miltchev

Page 3 of 5

How to Passively Monitor Linux Machines with NRDS & Nagios XI

When active agent-based monitoring is not an option (because of a firewall, or security restriction), passive monitoring can provide the solution necessary to maintain network security and health. Today we will be discussing Nagios Remote Data Sender (NRDS) and how it can monitor Linux machines using passive check results. Passive results are sent to the Nagios Remote Data Processor (NRDP) server and processed in Nagios XI.

The NRDS client configuration can be managed centrally via the NRDS Config Manager Component in Nagios XI. Updated configuration files on the NRDS server are automatically picked up by all clients. The NRDS client runs on a cron job at a specified interval. Each time it runs, it will do the following:

  • Run all of the commands, specified in the config file
  • Send the results back to the Nagios XI server
  • Check if there is a new version of the configuration file on the Nagios XI server, and if there is one, it will download it
  • Download all of the plugins it needs from the server and install them on the client

In this article, I will show you how you can start monitoring a Linux host passively in three easy steps.

Step 1  – Adding Configuration

Go to Admin -> Monitoring Config -> NRDS Config Manager, click on Create Config, and select Linux from the Operating System drop-down menu.
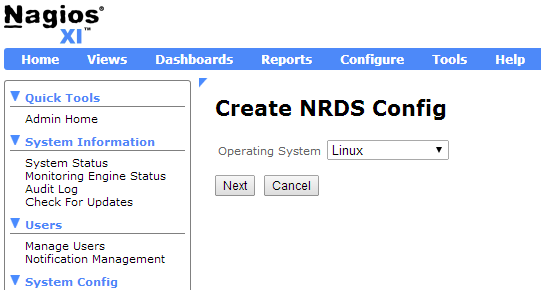
Create NRDS Config

Continue reading ‘How to Passively Monitor Linux Machines with NRDS & Nagios XI’

Monitoring a Linux Machine with Nagios XI & NCPA

Last week we discussed monitoring a Windows machine with NCPA and Nagios XI to make sure that the server was functioning properly.  In order to showcase the cross-platform capabilities of NCPA (Nagios Cross-Platform Agent) we decided it would be a good idea to show how to monitor a Linux machine as well.  In this article I will show you how easy it is to monitor a Linux box using the same exact agent that we used to monitor the Windows box last week.  Here’s how you do it.

1. Installing and configuring NCPA on the remote box

Instructions on installing NCPA can be found here: NCPA Installations Instructions. For more info on acquiring the correct RPM packages for your Linux distro, please check our documentation here: Finding the Right RPM

Run the following commands from the command line as root:

Note: For my example, I used CentOS 6.5, 64-bit, so I ran:

Next, you will have to edit the “community_string” in the NCPA config file. The “community_string” is the token that you will use to log into the agent and also allows the Nagios XI server to communicate with the NCPA agent. This process is comparable to entering a token in the GUI installer when monitoring a Windows machine. Continue reading ‘Monitoring a Linux Machine with Nagios XI & NCPA’

Monitoring a Windows Machine with Nagios XI & NCPA

We have recently developed a cross-platform monitoring agent called NCPA that is designed to simplify the monitoring of devices with a wide variety of operating systems. NCPA can be used as a passive or active agent and monitors a multitude of different metrics right out of the box. In this article I will show you how easy it is to monitor a Windows machine with Nagios XI and NCPA. To do this, simply follow these 3 easy steps:

Step 1 – Installing and configuring NCPA on the remote box.

The NCPA installer can be downloaded here: NCPA’s Installer Direct Download. Instructions on installing NCPA can be found here: NCPA Installations Instructions. Download it on the Windows machine that you want to monitor and run the installer.

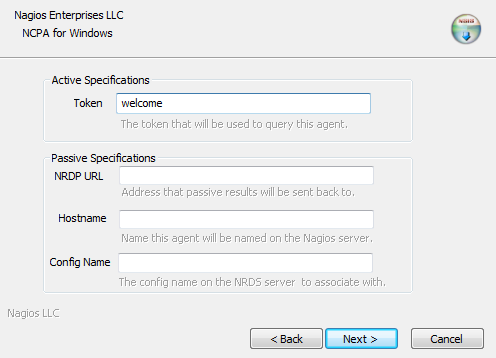
In this example, we will be using NCPA as an active agent.  This is the quickest and easiest way to begin monitoring with NCPA.  The image below is what the installation GUI looks like on the Windows device that you’re monitoring.  To use NCPA as an active agent, all you have to do is enter a token.  This token will be used to authenticate the connection between the Nagios XI server and the monitored device later in the article, so it’s important to choose a token you will remember. For this example, we entered “welcome“.  Click Next to finish the installation.

NCPA Installation Instructions

Continue reading ‘Monitoring a Windows Machine with Nagios XI & NCPA’

Using the Mass Acknowledge Component in Nagios XI

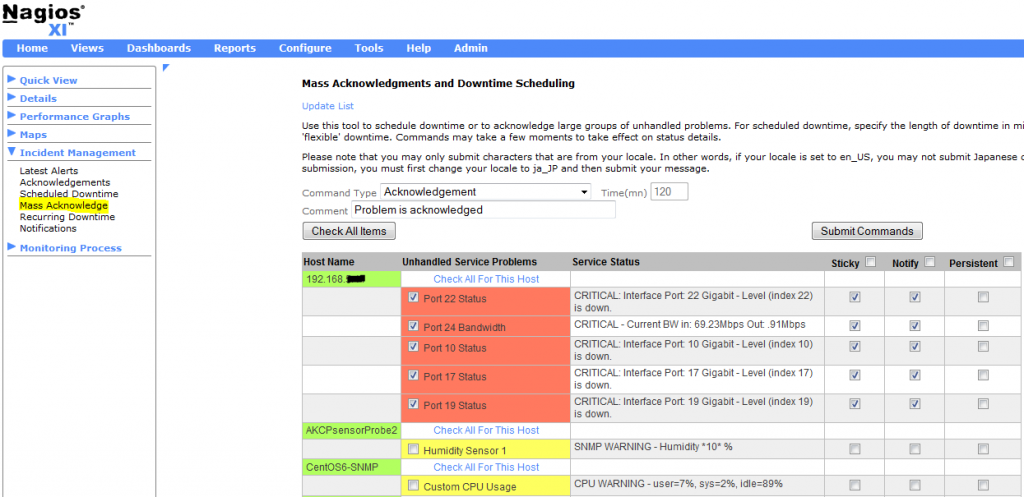
The Mass Acknowledge component in Nagios XI 2014 makes it very easy to mass acknowledge problems with hosts/services that are in non-OK state. The component allows you to suppress additional alerts to be sent out, while a team member works on resolving the issue(s). This component can also be used to schedule downtime for hosts/services, or schedule immediate checks in bulk.

From the Nagios XI Home page, navigate to Incident Management –> Mass Acknowledge. Select the function you would like to use from the Command Type drop-down menu. Then, select the hosts/services you wish to target. You can select some of the hosts/services by clicking on each checkbox or you can select all of them at once, by clicking on the Check All Items button. If you suspect that there are more hosts/services in a non-OK state than those you see on the page, you can always click on the Update List button on the top to update the list.

Next, set the length of downtime in minutes, and enter a comment. You have an option to choose whether to send or not to send alerts. Simply select or deselect the appropriate Notify checkboxes. Also, you have an option to make some (or all) of your comments Sticky or Persistent.

Note: If you want acknowledgement to disable notifications until the host/service recovers, check the Sticky acknowledgement checkbox. On the other hand, if you would like the host/service comment to remain once the acknowledgement is removed, check the Persistent acknowledgement checkbox.

Finally, click on the Submit Commands button.

Mass Acknowledgements and Downtime Scheduling in Nagios XI

Continue reading ‘Using the Mass Acknowledge Component in Nagios XI’