Archive for the 'Performance' Category

Page 2 of 3

Nagios XI Graph Explorer Component Released

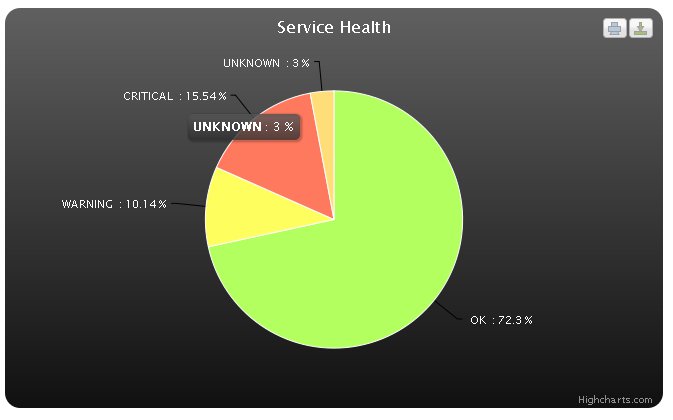
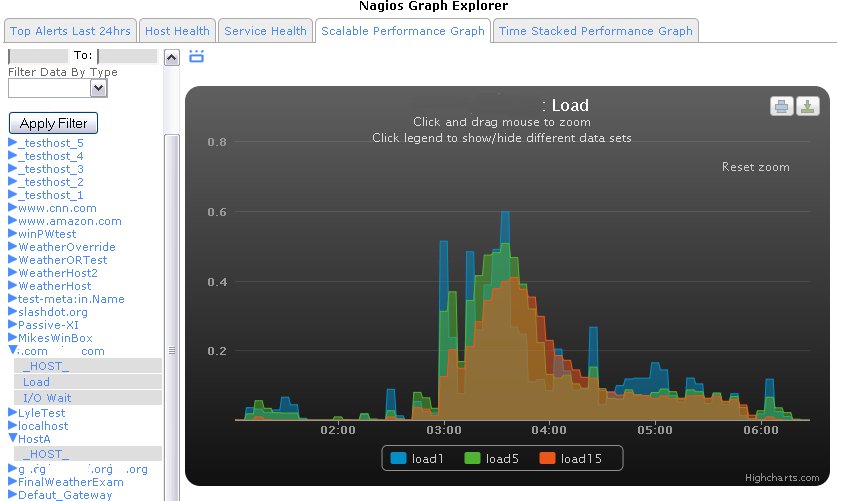
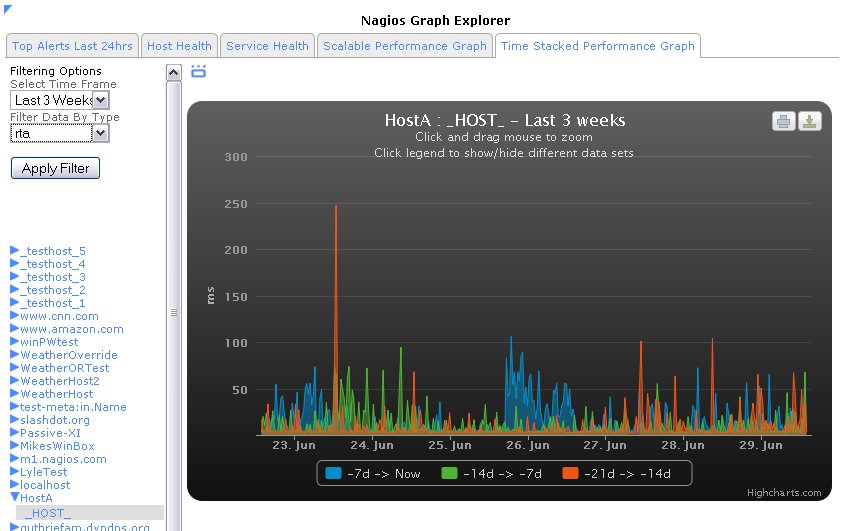
My brother (a fellow programmer) once told me, “the solution is easy once you know what it is.”  That’s been the case for the finishing touches needed to finally release a component that I’ve been excited about for a long time: The Nagios XI Graph Explorer.  This component utilizes a javascript visualization library and allows users to easily zoom graphs, select custom time frames, and even stack time periods on top of each other to compare performance from one time period to the next.  If you like data visualization, you’ll love this tool.  Currently this download is for current Nagios XI customers only and can be downloaded from the Nagios XI Customer Downloads page, and I recommend using this with Firefox for maximum reliability.  Special thanks to Nicholas Scott for accidentally pointing out the solution to the problem that’s been in front of my face the whole time ; )


Helping MySQL Move Out And Find Its Own Server

Anybody keeping tabs on the performance of their NagiosXI server knows that mysqld, httpd and nagios all play an intense game of king-of-the-CPU.   The cool thing about NagiosXI is that it comes with NDOUtils out of the box, which is a great tool for offloading the MySQL server, which is great if you need to stack on more checks.  If you run a NagiosXI server that is completely loaded down and have another server that could host a MySQL server for that NagiosXI server, this  PDF would definitely be worth a read. The PDF attached is a step-by-step guide to migrate your existing MySQL server to a remote MySQL server and is definitely an interesting look at just how exstensible NagiosXI is.

Offloading MySQL to a Remote Server

Nagios Visualization Toolkit (Under Construction)

In the past months we’ve had several requests for better control and time specifications for Nagios performance graphs, and me being a big fan of fancy visualizations, I’ve been staring at the old PNP graphs for a while and wondering if there’s a way we can create graphs that look like they’re actually from this decade.  After reviewing several different visualization libraries, we decided to take a stab at developing some new tools with some graphing libraries from HighCharts.  Although some of the fine details are still being polished, our first prototype has us pretty excited about where this project is headed.

Graph

JQuery Performance Graphs in XI

Our first prototype is a zoomable performance graph, that allows you to specify start/stop times, and then dynamically zoom the graph all the way down to a 5mn interval for closer examination.  Although these graphs are client-side, they can all be exported into either png, pdf, jpg, or SVG images to use in external reporting or presentations.  Let us know what you think!

Distributed Monitoring Solutions For Nagios

Distributed MonitoringInterested in scaling your Nagios deployment to monitor a large environment?  Distributed monitoring may be the solution you’re looking for.  We just created a document that describes different methods for configuring a distributed monitoring solution with Nagios Core and Nagios XI.

Distributed_Monitoring_Solutions.pdf