Every once in a while, a new database pushes to the front of the news. These databases generally bring a renewed schema and some neat tricks and features others may not offer. Due to the increasing popularity of MongoDB NoSQL databases, we have designed two new wizards for use with Nagios XI 2014: the MongoDB Database Wizard, and MongoDB Server Wizard. Continue reading ‘Monitoring Your MongoDB Database and Server with the New Wizards in Nagios XI 2014’
Archive for the 'Wizards' Category
Page 2 of 4
We have recently developed a cross-platform monitoring agent called NCPA that is designed to simplify the monitoring of devices with a wide variety of operating systems. NCPA can be used as a passive or active agent and monitors a multitude of different metrics right out of the box. In this article I will show you how easy it is to monitor a Windows machine with Nagios XI and NCPA. To do this, simply follow these 3 easy steps:
Step 1 – Installing and configuring NCPA on the remote box.
The NCPA installer can be downloaded here: NCPA’s Installer Direct Download. Instructions on installing NCPA can be found here: NCPA Installations Instructions. Download it on the Windows machine that you want to monitor and run the installer.
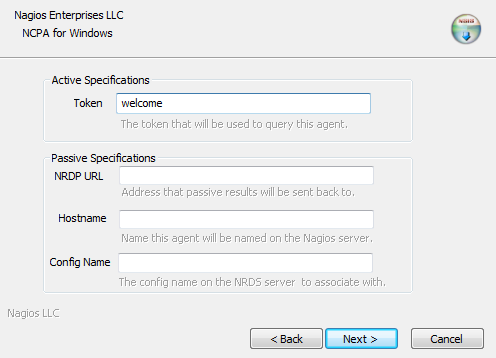
In this example, we will be using NCPA as an active agent. This is the quickest and easiest way to begin monitoring with NCPA. The image below is what the installation GUI looks like on the Windows device that you’re monitoring. To use NCPA as an active agent, all you have to do is enter a token. This token will be used to authenticate the connection between the Nagios XI server and the monitored device later in the article, so it’s important to choose a token you will remember. For this example, we entered “welcome“. Click Next to finish the installation.

Continue reading ‘Monitoring a Windows Machine with Nagios XI & NCPA’
It is quite easy to monitor VMWare infrastructures in Nagios XI. All you need to do is run the VMWare monitoring wizard, provided you had previously installed the VMWare Perl Software Development Kit (SDK) on the Nagios XI server.
Note: To learn how to install SDK, please, refer to our “Nagios XI – Monitoring VMWare” document.
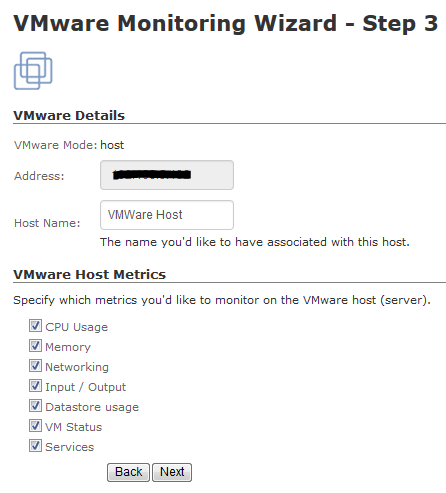
From the Nagios XI web interface, click on the “Configure” menu and select “Run the Monitoring Wizard”. Scroll down to select the VMWare monitoring wizard. Enter the IP address of the VMWare server, login credentials, select what you would like to monitor (VMWare host or a guest), and click “Next” to proceed. In Step 3 of the wizard, you will have to select the metrics that you would like to monitor such as CPU Usage, Memory, Services, etc.

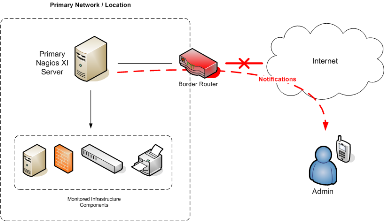
Many people rely on Nagios XI for their monitoring needs, but what happens if the primary XI monitoring server goes down, crashes, loses power, or gets disconnected from the network? For example, if your border router or internet connection goes down, Nagios XI will be unable to deliver email alerts to admins. See below:


