Tag Archive for 'monitoring'

Page 2 of 5

Monitoring Weblogic Metrics with Nagios XI

Weblogic is a popular Java-based application server that acts as a middleware between the application and the Java environment.  It provides a framework for developing traits such as reliability (recovering from failures), scalability (dynamic service scaling) and security (unified security system for apps).  Nagios XI has the ability to monitor various aspects of Weblogic using wlsagent as outlined in our document Monitoring WebLogic With Nagios XI. In this post I will expand upon some of those metrics, such as what they mean and why they are important.  Links to further reading will be provided where relevant.
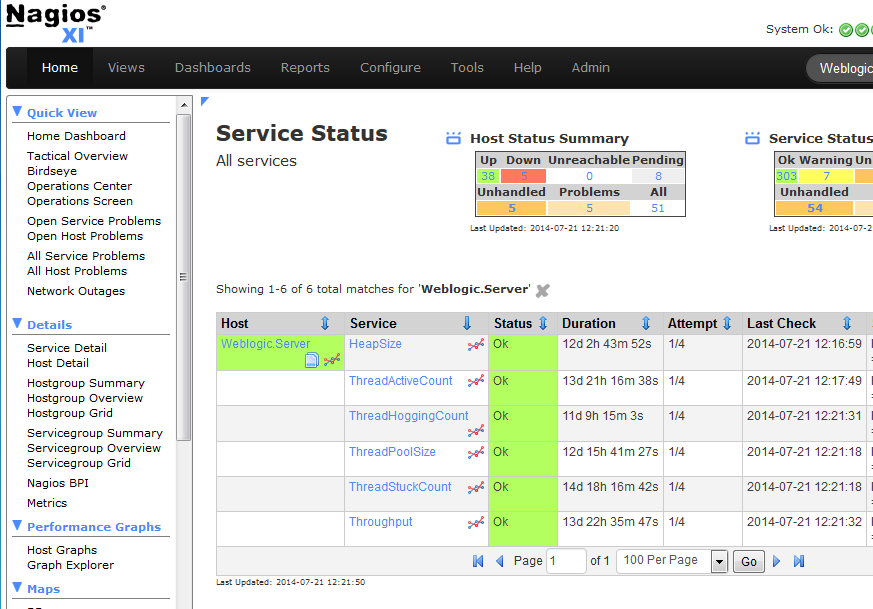
Nagios XI Service Status Dashboard

Continue reading ‘Monitoring Weblogic Metrics with Nagios XI’

Monitoring Apache Cassandra Database Nodes with Nagios XI

As cloud services grow in popularity, so do the networks that provide those cloud services.  Few webserver-based distributed databases are as easy to install and configure as Apache Cassandra.  Apache Cassandra is an open source distributed database management system designed to handle large amounts of data across many commodity servers, providing high availability with no single point of failure. Cassandra offers robust support for clusters spanning multiple data centers, with asynchronous master-less replication allowing low latency operations for all clients.

Cassandra relies on the Java platform, and as those of you who have tried to configure Java app monitoring most likely know, the experience can be painful.  There are a handful of plugins on the Nagios Exchange that attempt to simplify the configuration.  As these plugins rely on the Apache Cassandra utility “nodetool”, you either need to install Cassandra on the Nagios server (which is not suggested) or use an agent (like NRPE) to run the plugin script directly from the Cassandra server (which should have the nodetool utility).

The Cluster Node Check is designed to verify whether the number of live nodes is less than a specified number, and if so trigger a warning or critical alert within Nagios.

Continue reading ‘Monitoring Apache Cassandra Database Nodes with Nagios XI’

Nagios Cloud Monitoring Now Available in Sydney Australia

TheAmazon Web Services (AWS) latest Nagios XI – Amazon EC2 cloud images have been pushed out to the following additional location:
  • Australia (Sydney)

The Nagios XI cloud images are an excellent opportunity to try Nagios XI without having the upfront expense of dedicated hardware and can be upgraded with virtually zero downtime.

Continue reading ‘Nagios Cloud Monitoring Now Available in Sydney Australia’

How to Passively Monitor Windows Machines with NRDS & Nagios XI

In my previous article, I demonstrated how easy it is to passively monitor Linux machines with Nagios Remote Data Sender (NRDS) and Nagios XI. In today’s article, I will cover passive monitoring of Windows machines via NRDS.

Monitoring Windows machines via NRDS is no different than monitoring Linux boxes. You need to follow the same three steps:

  1. Adding Configuration
  2. Client Installation
  3. Configuring the host and its services

Step 1 – Adding Configuration

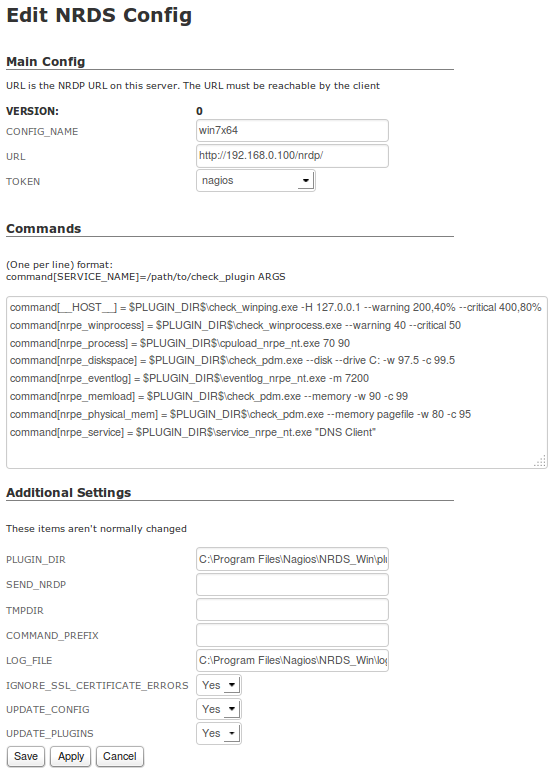
Go to Admin -> Monitoring Config -> NRDS Config Manager, click on Create Config, select Windows (32- or 64-bit) from the Operating System drop-down menu, and click on the Next button. You will see the Edit NRDS Config page. Most of the config options will already be populated for you with the default options. All you will need to do is type a config name, select a token from the drop-down menu, and click on the Apply button. For this example, we will be creating a config called “Win7x64”.

Edit NRDS Config

Continue reading ‘How to Passively Monitor Windows Machines with NRDS & Nagios XI’