Archive for the 'UI' Category

Page 2 of 3

Nagios XI 2012r1.4 Improvements

With each new version of Nagios XI, we do our best to include the most important bug fixes, improvements, and features that we can accomplish in a few weeks time. The upcoming Nagios XI 2012r1.4 is going to be a notable release of XI for both performance improvements and internationalization.

Internationalization

For our international users, we’ve been hard at work to update XI appropriately for internationalization, as well as kick-starting multiple translations using Google translate. We’ve been working to balance code updates with community contributions for languages, and this upcoming release will ship with a default.pot file that can be used to update user’s PO files that they may have begun populating. This release of XI will ship with kick-started translations in the following languages.

  • German
  • Spanish
  • French
  • Italian
  • Portuguese
  • Russian
  • Korean
  • Chinese

Performance Improvements in 1.4

For customers with larger installs, we’ve been analyzing bottlenecks in both the monitoring process and the UI to try and make XI run faster and leaner. Users with hosts+services in the thousands will almost certainly see an improvement both in CPU load and page load times in the UI. For changes that affect the monitoring process, we updated the Monitoring Engine Event Queue dashlet and the Monitoring Engine Check Statistics Dashlets to all pull data from the same status information that the rest of XI uses, which reduces an enormous amount of data from needing to be logged to mysql from the monitoring process. The end result of this change is that mysql will only need to be doing about 30% of the work that it was having to do in previous releases. For large installs, this is a big deal!

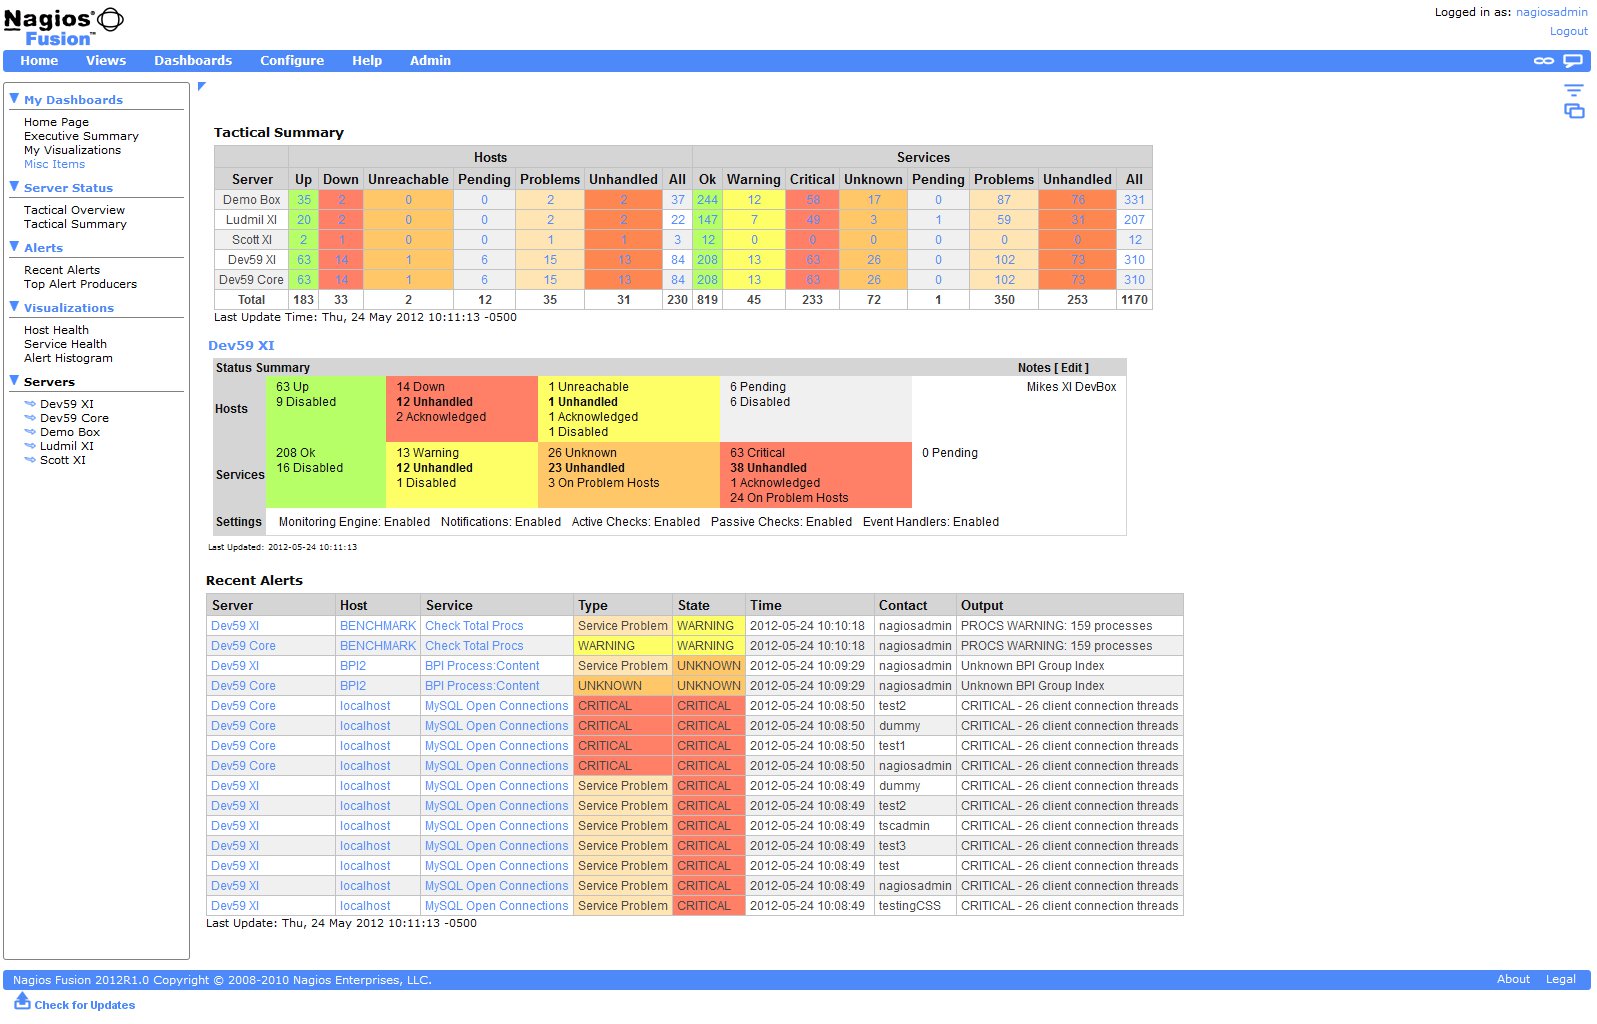
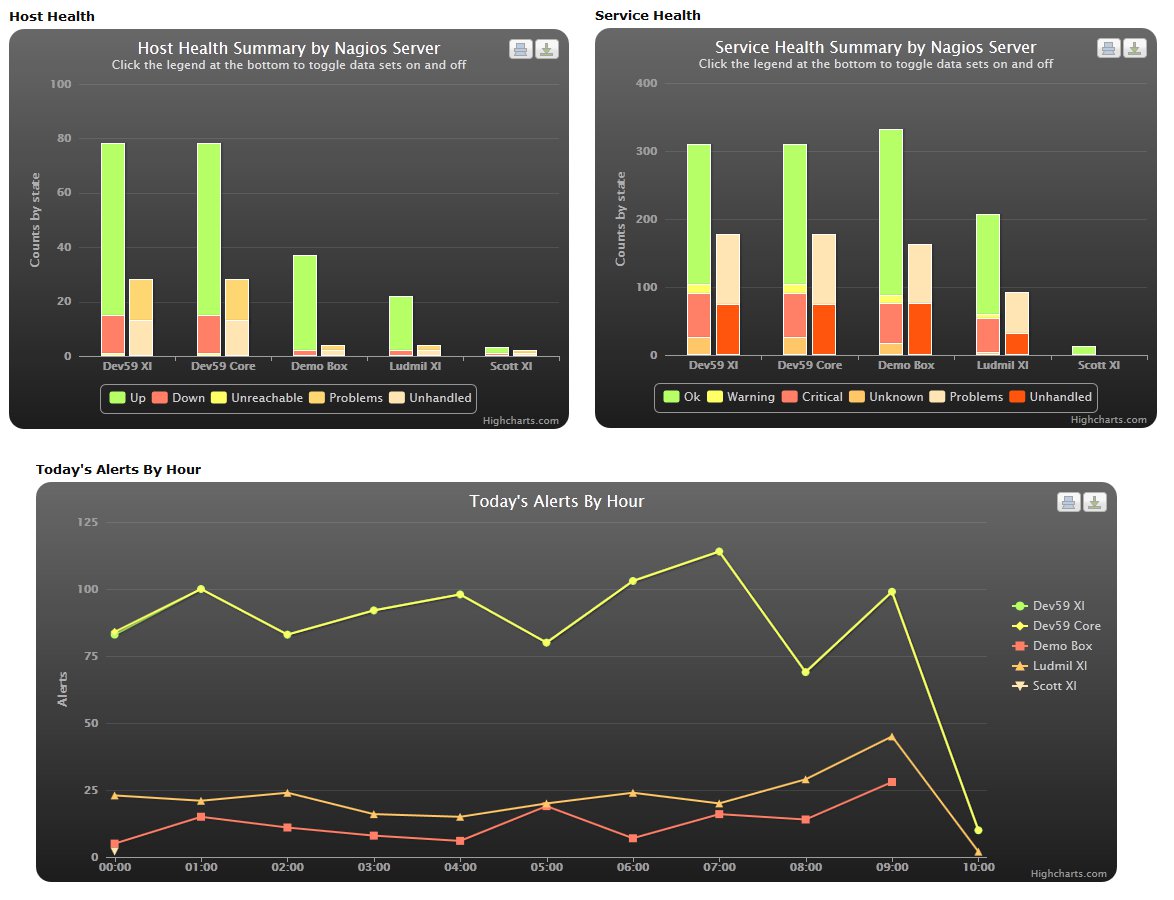
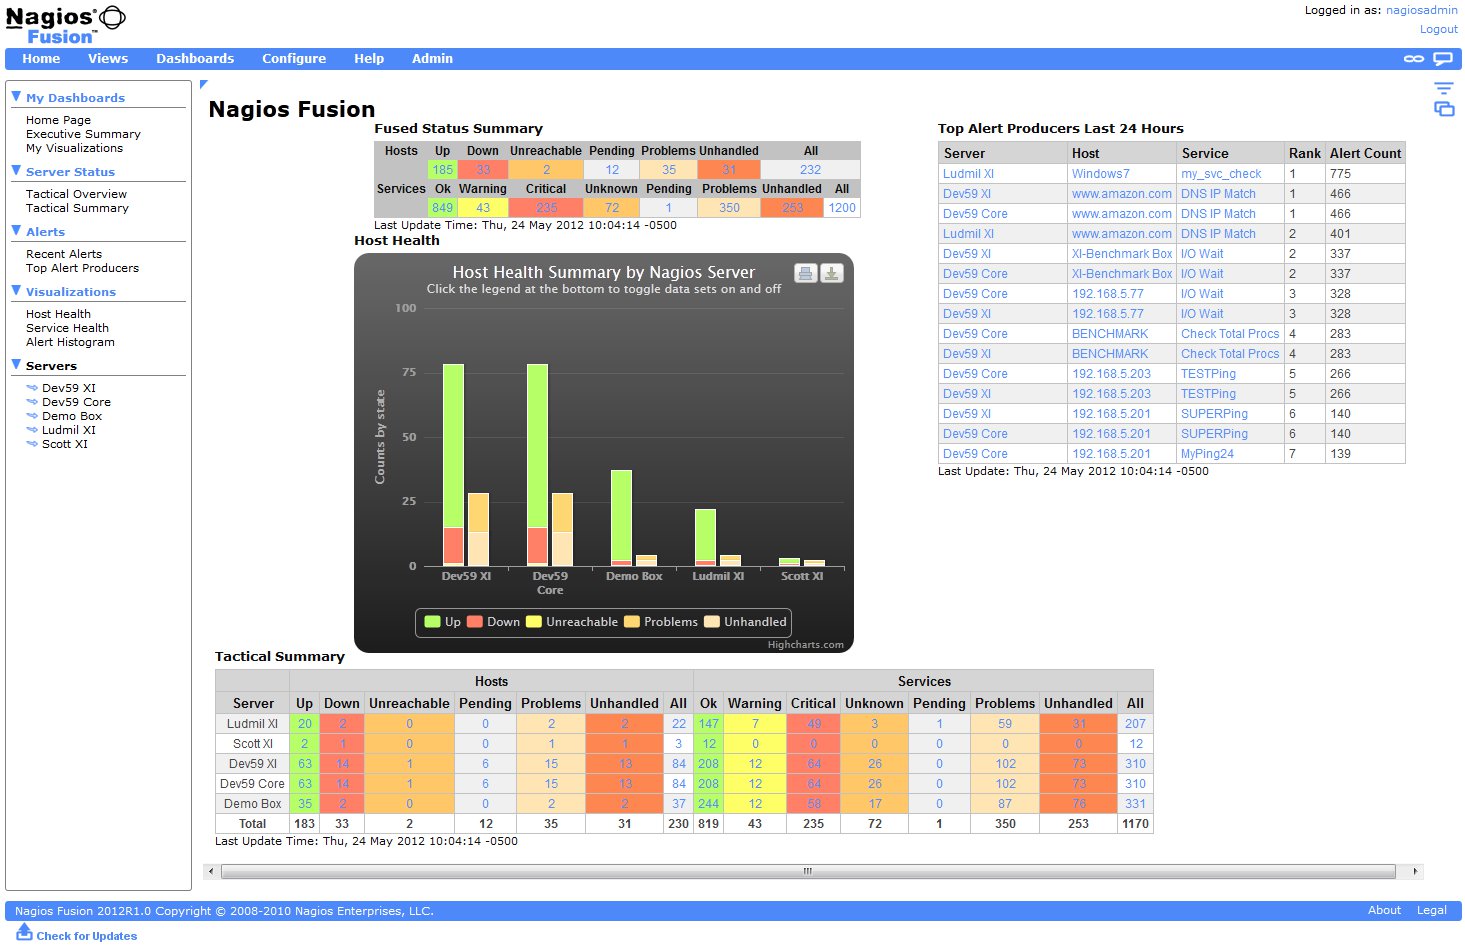
The other key change that all users will probably see a benefit from is a refactoring of data queries for AJAX loaded content in the XI interface. Load times for dashlets that contain tactical or summary data went from 15-20 seconds per dashlet down to .05 seconds in local tests with 10k checks. The other upside of this change is that the CPU usage from XI users accessing the interface is substantially reduced. The Tactical Overview dashlets see the largest benefit in load times by far. For users who had to utilize the unified Tactical Overview for performance reasons, we encourage you to try the dashlet version in 1.4.

We hope to have 1.4 ready to release sometime this week, we appreciate our community of users and the feedback that we continue to get for our product. Thanks for helping us make XI better!


Nagios XI 1.3 New Features For Developers

It seems almost daily that we get new feature requests for Nagios XI, and thanks to a great extensible design by Ethan Galstad, the development team here at Nagios is able to produce new features and components for Nagios XI on a fairly regular basis. However, as the popularity of Nagios XI continues to grow, so does the need for custom features, modifications, and tools for our customers to use. We’ve added several new features and developer hooks into this most recent version of Nagios XI that we wanted to highlight for users who are interested in creating their own custom feature.

#1. Custom login splash. Several of our resellers have requested the ability to customize the login splash page when users log in to direct their end users to their own support channels and services. We’ve add the ability to allow users to specify their own PHP include for that splash by using the Custom Login Component. A template splash file has been added to the Nagios XI directory tree, and will be preserved through upgrades if users want to modify it. This file is located at /usr/local/nagiosxi/html/loginsplash.inc.php.

#2. Custom status column. We’ve added some new callback functions with this release of Nagios XI, one of which is a callback that allows users to add a new table column to the host or service status tables in Nagios XI. A developer example that adds the host notes field to the status tables can be downloaded from the following link. Custom Column Component.

#3. Custom table icons. Thanks to active community member jsmurphy for this one. We’ve added a new callback function in Nagios XI where custom table icons can be inserted the status tables to act as links, or to perform special actions. This feature is demonstrated in the latest version of the Graph Explorer component, where it inserts a graph icon that can be clicked to show a performance graph pop up for the selected host or service right from the status table.


The bottom line is, we love feature ideas! We base our development priorities largely on what users are requesting from us, so if there’s a feature you want to see in Nagios XI, by all means post a request to tracker.nagios.com or discuss an idea with our tech team at our Nagios Ideas forum.


Nagios Fusion 2012 Preview

Need a simpler solution for scaling Nagios?  Distributed monitoring environments often contain several Nagios servers in order to cover multiple geographic or network locations, or sometimes just to scale large enough on a single network.  Nagios Fusion 2012 is a central dashboard and data aggregation for all of your Nagios installations.  Fusion 2012 will integrate seamlessly with Nagios XI and Nagios Core 3.x installs, and requires no additional configuration changes on any of your Nagios servers.  Here’s a highlight of the current feature list:


  • Unified authentication for all Nagios XI servers
  • User-defined, customizable dashboards and menus
  • Easily drill down to any Nagios server to find problems
  • Fused Tactical Overview information
  • Fused Health Summaries for Nagios servers
  • Fused  Alert Summary
  • Fused Alert Histogram
  • Fused Top Alert Producers
  • Several new data visualizations


The power exists in Nagios Fusion to aggregate almost any information across multiple Nagios installs.  The main question we’re looking at from here is: “What do users want to see in their central Nagios dashboard?”  We’re interested in getting some user feedback for ideas on this project as well as some beta testers for the upcoming release.  Here are some screenshots to give an idea as to what is to come.


Nagios V-Shell 1.9 Released

Nagios V-Shell 1.9 includes major performance updates, and a re-implementation of PHP caching that should decrease V-Shell page load times anywhere from 40-75%.  I ran some benchmarking tests on a test system(Dual core desktop with 4GB of RAM) with 1800 hosts, and 7200 services.  This system runs with an average CPU load of 2.0-6.0 throughout the day, so the hardware is being pushed pretty hard already from the check load. V-Shell 1.8 created page load times anywhere from 18-28 seconds throughout the interface without APC caching enabled.  Needless to say, this is problematic for many users with larger environments.  The Core cgi’s were able to load anywhere from 2-11 seconds, with the service status page taking around 9-11 seconds to load all of the data.  My goal for 1.9 was to minimize any unnecessary processing, and optimize any functions that were inefficient or using slower PHP built-in functions.  The differences in 1.9 are substantial.  Without any caching enabled at all, I was able to decrease the average page load time to 9-14 seconds, which is 40-50% faster by itself.  Once I had the code optimized, I reworked the APC caching functionality.  If a user has PHP’s APC caching packages installed and enabled on their web server, V-Shell will cached the objects.cache file until it detects any changes in the file, while the data in the status.dat file will be cached based on a TTL (time to live) config option which now exists in 1.9.  Once the data is cached in APC, the page load times throughout the interface averaged between 4-5 seconds for all pages, which is a 75% decrease in load time on average.

My goal for the next version of V-Shell is to add support for mklivestatus and ndoutils for backend data, which will eliminate the need to parse the objects.cache file and status.dat files for systems with those backends.  This should further improve performance for larger installations.

Download Nagios V-Shell 1.9

CHANGELOG