One of the most challenging, but also rewarding projects that I’ve worked on so far during my time at Nagios is the Nagios Business Process Intelligence (BPI) project. Nagios BPI was created as a way to visualize business process health by grouping hosts and services together, and creating rules to discern the true health of the network infrastructure as it relates to the business. An admin can define rules for each BPI group, and monitor the health of the group’s state based on what has been defined. Version 1.x of BPI got a lot of positive feedback from users, and quite a few feature requests. However, as time went on it became clear that in order for BPI to be more suitable for enterprise environments, more advanced permissions needed to be implemented, as well as several other usability issues resolved. I’ve spent the last 6 weeks or so doing some seriously overhauling to the code in order to support a lot of the new features I wanted to add to a new version of BPI. I’m excited about the changes in this new version, and I also really think that this is an add-on to Nagios that can really do some good in a lot of monitoring environments. I think the future of monitoring is going to highlight the idea of monitoring within the context of the business, and this project allows users to turn host and service monitoring into actual business process monitoring. Currently this project is in a beta stage and only works with Nagios XI, and we plan to implement this as a feature of our 2012 release. A community version of Core will follow sometime later in 2012, but the intention is to pilot a lot of these new features in the XI environment, and later the code can be adapted to allow for use with Core installs as well. Here’s a highlight of the new features in BPI v2.0
- AJAX based updates keep the data fresh without ever having to refresh the page
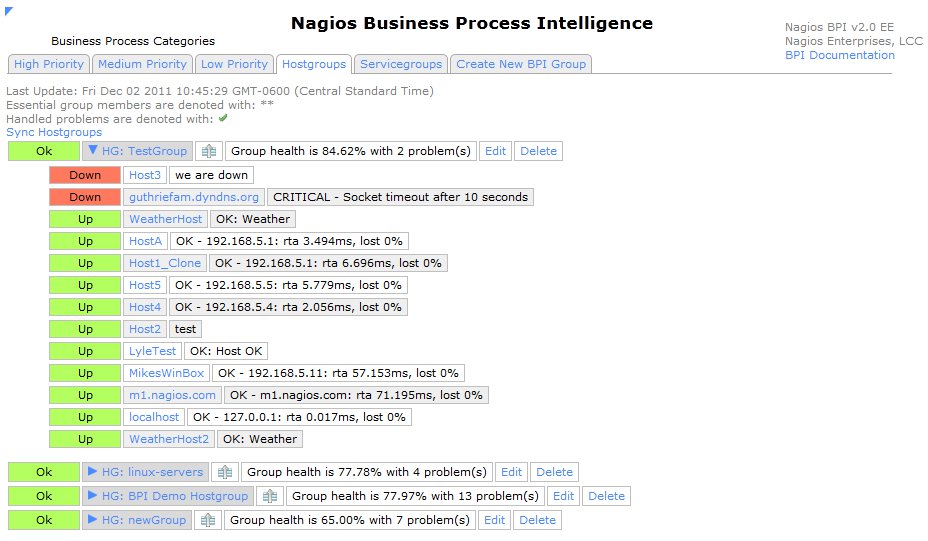
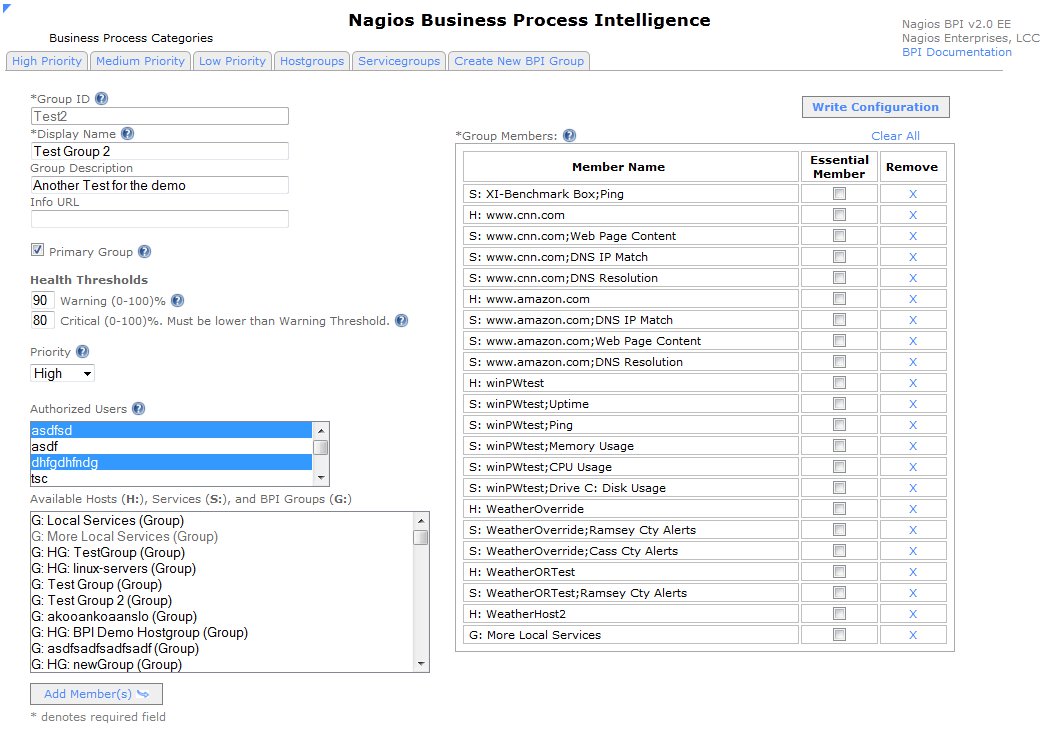
- BPI Groups can be automatically generated and synced with existing hostgroups and servicegroups, and rules can be set for determining their group states.
- Improved permissions scheme. Only Admin-level users can add, modify, or delete groups. All other users can be added as “read-only” users for each group, which allows for use of BPI in multi-tenancy installs of XI.
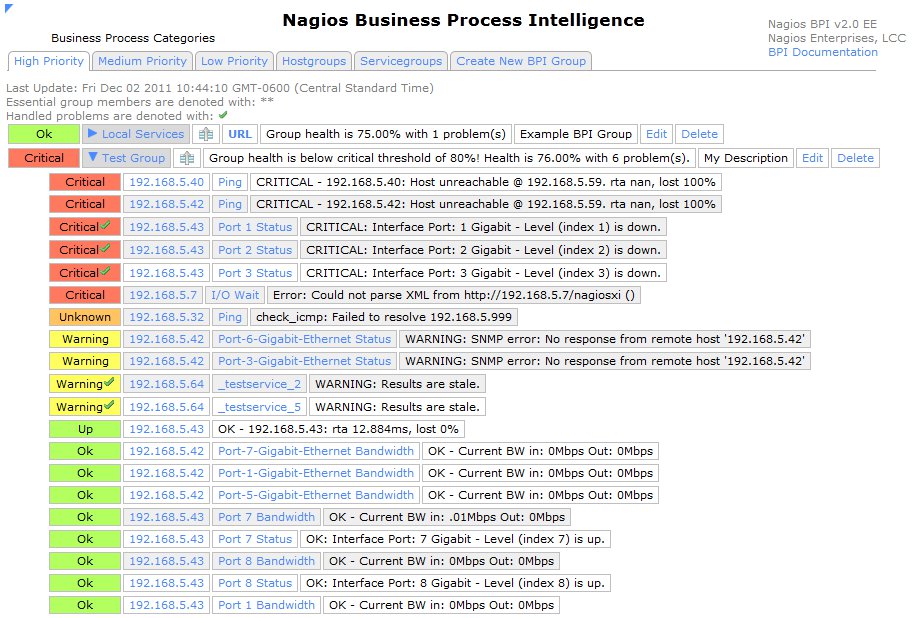
- Groups can now be sorted by problem “weight,” which allows for quicker identification of problems within the business process.
- Group state calculations now use health percentages instead of problem counts in determining group states.
- Group state calculations can account for “handled” problems in the logic, as defined as a config option.
- More informational feedback for the check plugin so a user knows “why” a group is in a problem state.
- Created an XML cache/API for reduced CPU usage for BPI checks, and also to allow external applications to access the data.
See the updated documentation for BPI v2 here.
The code for this new version has not yet been released. Feel free to contact me if you’re interested in beta testing before the 2012 release of Nagios XI. Here are a few screenshots from the new version.
UPDATE: Advanced business process monitoring (BPI v2) is an Enterprise-only feature of Nagios XI. Learn more about the differences between Standard and Enterprise here.