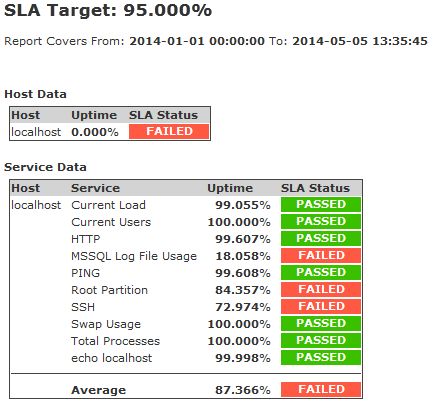
New to Nagios XI 2014, is the ability to generate reports based on service level agreement (SLA) statistics. In addition to the already included Availability Report, the SLA Report gives you the ability to prove, via already monitored hosts and services within your Nagios system, that you are meeting or exceeding those pesky up-time agreements.

As per traditional Nagios XI reporting capabilities, there are a wide variety of included time periods that will fit most use cases, as well as the ability to generate reports based on custom time periods. Reports can also be filtered by Host, Hostgroup, and Servicegroup for maximum flexibility when only specific hosts and services need to have reports generated. The final important aspect when generating a report is the modifiable SLA Target value. This allows you up to 5 points of precision when generating reports and can fully calculate the five 9s(99.999%) used in so many cases.
Once a report is generated, you are presented with the overall SLA percentile reached for both hosts and services included within your parameters. Initially, the report may look sparse, however selecting the Show Details link for either hosts or services, will greatly expand the page and show metrics for each group.

You can find more details on the new SLA Report’s functionality at Generating SLA Reports With Nagios XI
If you would like to try out the new SLA Report and see the latest version of Nagios XI 2014 in action, you can give it a test run by downloading Nagios XI 2014 here with a fully functional 60 day free trial.
Remember, Nagios World Conference 2014 is coming up in October. Register here for 10% off your conference pass. Act now, because this offer won’t last long!


0 Responses to “Using the New SLA Report within Nagios XI 2014”