Archive for the 'Reports' Category

How to Add Nagios Network Analyzer Reports in Nagios XI

If you are currently using both Nagios XI and Nagios Network Analyzer, the release of Nagios XI 2014 has made it very easy to add Nagios Network Analyzer reports in XI. All you need to do is to configure the Network Analyzer Component in Nagios XI. Here’s how you do it:

  • From the Nagios XI Web interface, click on the Admin menu, then click on the Manage Components menu.
  • Find the Nagios Network Analyzer Component and click on the Edit Settings button.
  • Click the Add a Server button.
  • Enter the required information, and click Apply Settings.

Nagios Network Analyzer Component Settings

Continue reading ‘How to Add Nagios Network Analyzer Reports in Nagios XI’

Using the New SLA Report within Nagios XI 2014

New to Nagios XI 2014, is the ability to generate reports based on service level agreement (SLA) statistics. In addition to the already included Availability Report, the SLA Report gives you the ability to prove, via already monitored hosts and services within your Nagios system, that you are meeting or exceeding those pesky up-time agreements.

Options for SLA Reporting in Nagios 2014

As per traditional Nagios XI reporting capabilities, there are a wide variety of included time periods that will fit most use cases, as well as the ability to generate reports based on custom time periods. Reports can also be filtered by Host, Hostgroup, and Servicegroup for maximum flexibility when only specific hosts and services need to have reports generated. The final important aspect when generating a report is the modifiable SLA Target value. This allows you up to 5 points of precision when generating reports and can fully calculate the five 9s(99.999%) used in so many cases.

Continue reading ‘Using the New SLA Report within Nagios XI 2014’

Monitoring Gas Prices Using Capacity Planning in Nagios XI

Nagios XI is the most powerful IT infrastructure monitoring solution on the market.  You can use it to monitor virtually anything.  Although Nagios XI is typically meant for more “serious” work, you can have some fun with it as well!  I guess I have been somewhat nostalgic lately…  Do you remember when a gallon of gas used to cost less than a dollar? 🙂

In this article I will show you how to install the check_gas_price.py plugin, set up a dummy host, and add multiple services to it.  This will allow you to check the gas prices in the USA.  Then you may use the Capacity Planning component in Nagios XI Enterprise Edition to view the trends of gas prices in the USA.

First, download the check_gas_price.py plugin from this URL:

http://assets.nagios.com/downloads/nagiosxi/scripts/check_gas_price.py

Next, install the plugin from the Nagios XI web interface by going to: Admin –-> Manage Plugins –-> Choose File, then select the check_gas_price.py file and click Upload Plugin.

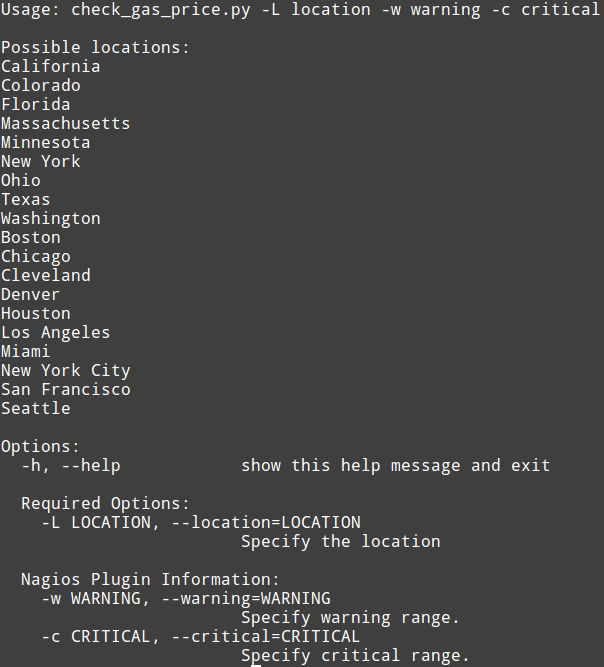
If you would like, you can view the plugins’ usage by typing in terminal:

Your output should look like this:

Monitoring gas prices with Nagios XI - check_gas_price.py

Continue reading ‘Monitoring Gas Prices Using Capacity Planning in Nagios XI’

Nagios Incident Manager Public Beta

Nagios Incident Manager is an enterprise-class incident management application that allows teams and individuals to track and solve problems faster using a powerful web-based application that offers security, mobility, third-party integration, and tools for collaboration. Nagios Incident Manager can be integrated easily with Nagios XI or Nagios Core’s built-in event handling, or any other third party tool with an easy-to-use web API for creating and managing tickets. Nagios Incident Manager is currently available for public beta testing, with install instructions posted below. Supported installation platforms are CentOS and RHEL 5/6, and we recommend installing the beta on a clean system.

Beta Installation Instructions

Documentation and tutorials are coming soon!

For Nagios XI users, see documentation on Integrating Nagios IM with Nagios XI.