Recently I was asked the following questions via email and thought it would make a great post to explain the differences between deploying Nagios Log Server or just the Elasticsearch, Logstash, Kibana Stack (ELK).
The question was as follows:
In the company I currently work with, we were thinking about deploying ElasticSearch and Logstash along with Kibana, in order to further facilitate log processing and visualization.
What would the added value be if we went for Nagios Log Server instead of ElasticSearch, Logstash and Kibana?
Is there any downside in choosing to install ElasticSearch, Logstash and Kibana on our own instead of installing Nagios Log Server?
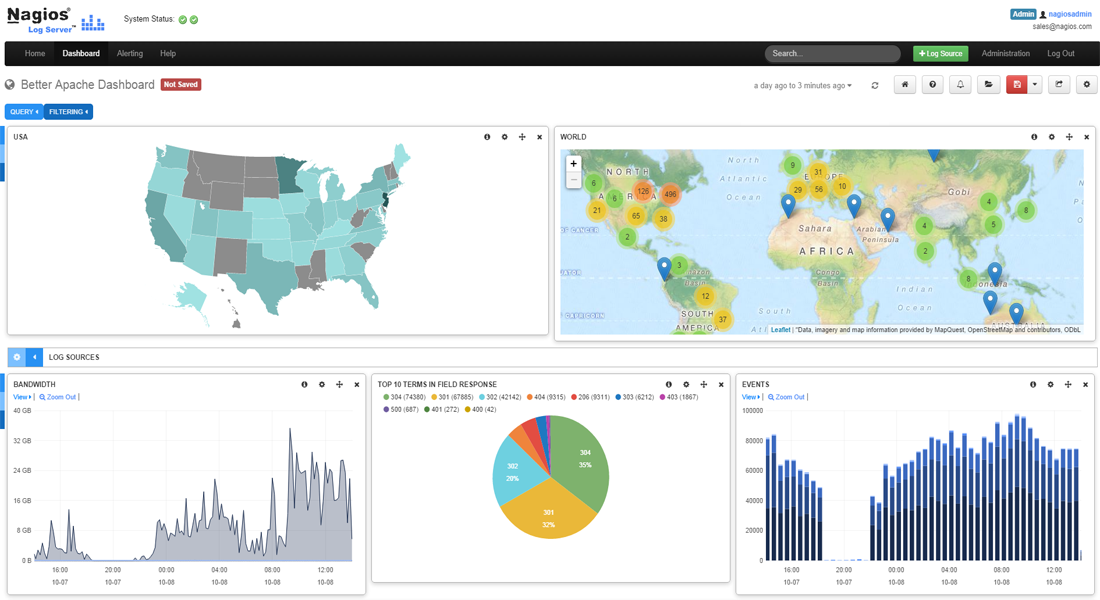 On the surface this is a really straight forward question, and was also asked right away in the Log Monitoring and Log Management with Nagios presentation I gave at the Nagios World Conference. Nagios Log Server does in fact use the ELK stack, and we are surely glad we chose the stack we did because of the outstanding performance, reliability, redundancy and expandability that it allows Log Server to take advantage of to build this spectacular product.
While both options allow a platform that will give the ability to index and analyze logs from various systems such as syslog, Windows Event Log, text based logs and many many more, Nagios Log Server was designed to be a full featured Log Management product, taking into account the needs of enterprise customers that require important items such as security and role based authentication.
So what makes Nagios Log Server stand out above the competition? Usually, it all comes down to cost. While other solutions may be “free” there is no such thing as free lunch, and the man hours learning about “free” technology, as well as the man hours configuring and maintaining such a system must be accounted for. Additionally, once the “free” system is deployed, who do you contact when something goes wrong, and what is the associated cost?
Added Value
To the point of added value I will list below the extra / added functionality that Nagios Log Server brings to the table over the standard ELK stack. For the most part, Nagios Log Server simply delivers the missing pieces expected in an enterprise solution, and at the same time provides commercial support for the product as well as saving many organization a ton of money, simply because we at Nagios have done the work figuring out all of the complex features, instead of you having to roll your own system out so to speak. Below is a short list of some of the value added features:
- Commercial Support – This one item alone makes Log Server stand out. All licenses come with customer only support.
- Easy installation – Setup is incredibly easy, either start with a pre-created VM or run a simple install script and your Log Server will be online in a few minutes. Setting up ELK for production does take a fair amount of knowledge for best practices, although they do make it pretty easy to get going in development environment.
- Easy cluster formation – Log Server makes sure every member of the cluster knows which IP’s/hostnames it should communicate with and constantly keeps the list current. While ELK does uses multicast discovery by default, this is almost never recommended in production.
- Authenticated UI and API – Believe it or not, the ELK stack does not come with any semblance of authentication or authorization, which means anyone that can access the ELK system on the network can not only read, but Delete or Modify your sensitive log data. Log Server has full authentication and authorization to all difference users access to different information, as well as an API that is secured with keyed access.
- Easy Log Source Wizards and Scripts – Built into Log Server are many easy setup instruction and scripts to make setting up various systems such as Windows Event Logs, or rsyslog a breeze to start sending logs into log server. Additionally, we have built in easy import functionality to get historical logs into Log Server.
- GUI based logstash configuration – I believe Log Server has the only GUI based logstash configuration management system in existence. Easily add logstash configuration inputs, filters, and outputs, with full drag and drop functionality. On top of that, from one central interface you can add, edit, modify and deploy the configuration files to ALL of the servers in your cluster instead of manually editing configuration files via text editor on each system manually.
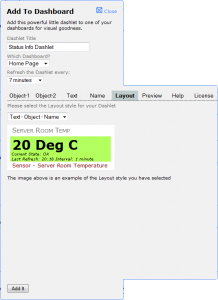
- Per user savable Dashboards – Users can save their custom dashboards that represent the log data the way they like to visualize it. Each user can have any number of custom dashboards.
- Per user savable Queries – Queries can be saved separate from dashboards, and you can apply different queries to be viewed in different dashboards.
- Global Dashboards and Queries – Both queries and dashboards can be saved as Global by administrators so other individuals can use them.
- Alerting based on Queries – Log server adds the ability to get alerts based on any query. alerts can be sent via email, sent to a Nagios Monitoring server, sent to an SNMP Trap Receiver, or passed to a custom script for execution.
- Automated Backup and Maintenance – Automated backup management is part of Log Server, and is basically set it and forget it function. Once you have set where you want your backup information stored, it will keep all of your precious logs safe and secure there in case you need to retrieve them in the future.
- GUI based Cluster Management – At a glance view and management of the Log Server cluster status right through the GUI.
- GUI based Instance Management – Granular view of every member of the cluster, including about 60 metrics such as, disk utilization, memory usage, system load, and so much more.
- GUI based Index Management – Detailed view (another 25 metrics per index) and actions on every index in the cluster, such as document count, size, and ability to open close, and delete indexes.
Any Downside to Log Server?
This is somewhat a loaded question, I’ll try to be as objective as I can. I can really only think of two.
- Not Always Free – While Log Server does offer a free version for a single instance up to an average of 500MB/day, Log Server is commercial software and isn’t free when scaled out to multiple instances, however, with an introductory price of $995, almost all organizations would have spent 10X that much in man hours alone just having their technical staff learn how to install and configure all of the open source components properly. Once your team has figured it all out, you would have to create any of the above items if they are of value to your organization.
- Currently Requires CentOS or RHEL – Currently Nagios Log Server is only supported on CentOS or RHEL operating systems, however we are working to get distributions on other operating systems available, and it can be run in a VM on virtually any OS.
We welcome additional questions in the comments below. Feel free to take Nagios Log Server for a fully functional 90 day free trial.


