Archive for the 'Passive Checks' Category

How to Passively Monitor Windows Machines with NRDS & Nagios XI

In my previous article, I demonstrated how easy it is to passively monitor Linux machines with Nagios Remote Data Sender (NRDS) and Nagios XI. In today’s article, I will cover passive monitoring of Windows machines via NRDS.

Monitoring Windows machines via NRDS is no different than monitoring Linux boxes. You need to follow the same three steps:

  1. Adding Configuration
  2. Client Installation
  3. Configuring the host and its services

Step 1 – Adding Configuration

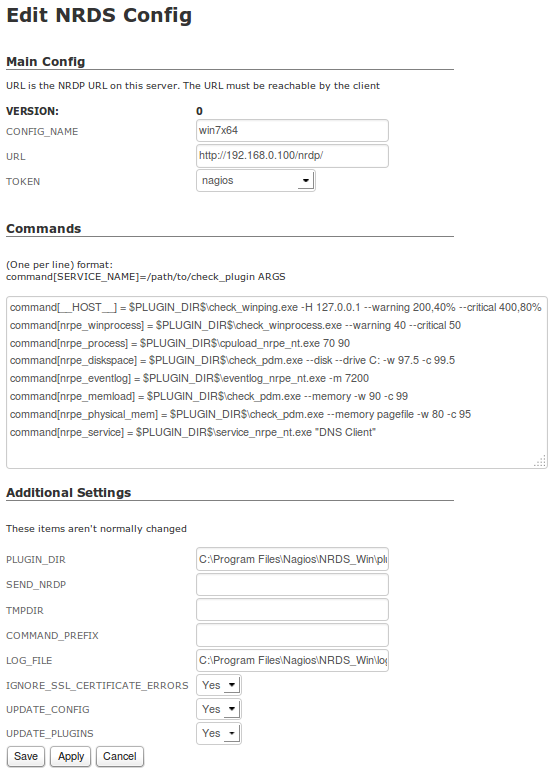
Go to Admin -> Monitoring Config -> NRDS Config Manager, click on Create Config, select Windows (32- or 64-bit) from the Operating System drop-down menu, and click on the Next button. You will see the Edit NRDS Config page. Most of the config options will already be populated for you with the default options. All you will need to do is type a config name, select a token from the drop-down menu, and click on the Apply button. For this example, we will be creating a config called “Win7x64”.

Edit NRDS Config

Continue reading ‘How to Passively Monitor Windows Machines with NRDS & Nagios XI’

How to Passively Monitor Linux Machines with NRDS & Nagios XI

When active agent-based monitoring is not an option (because of a firewall, or security restriction), passive monitoring can provide the solution necessary to maintain network security and health. Today we will be discussing Nagios Remote Data Sender (NRDS) and how it can monitor Linux machines using passive check results. Passive results are sent to the Nagios Remote Data Processor (NRDP) server and processed in Nagios XI.

The NRDS client configuration can be managed centrally via the NRDS Config Manager Component in Nagios XI. Updated configuration files on the NRDS server are automatically picked up by all clients. The NRDS client runs on a cron job at a specified interval. Each time it runs, it will do the following:

  • Run all of the commands, specified in the config file
  • Send the results back to the Nagios XI server
  • Check if there is a new version of the configuration file on the Nagios XI server, and if there is one, it will download it
  • Download all of the plugins it needs from the server and install them on the client

In this article, I will show you how you can start monitoring a Linux host passively in three easy steps.

Step 1  – Adding Configuration

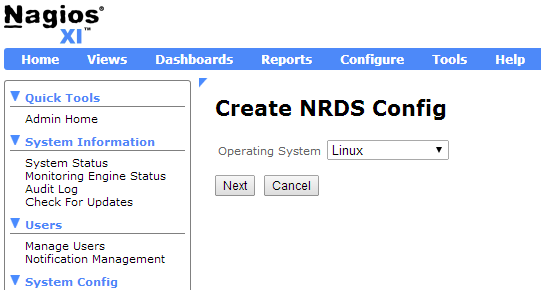
Go to Admin -> Monitoring Config -> NRDS Config Manager, click on Create Config, and select Linux from the Operating System drop-down menu.

Create NRDS Config

Continue reading ‘How to Passively Monitor Linux Machines with NRDS & Nagios XI’

Major Improvements to Agent-Based Monitoring with the Release of Nagios Cross-Platform Agent — NCPA

Major improvements to agent-based monitoring have been taking place at Nagios Enterprises. NCPA, the Nagios Cross-Platform Agent, is a project that has the potential to revolutionize agent-based monitoring and increase the efficiency of IT support teams world-wide.

As many Nagios users know, monitoring with agents means juggling the installation of many different types of plugins to try and match devices, operating systems, and the basic functions of each agent. For example, in a simple agent-based Linux and Windows server environment you have to install 2 agents, know the 2 user manuals, there are 2 times the troubleshooting hours required, 2 times the commands on remote systems, 2 change logs to sift through for potential update breaks…the list goes on. It can be very difficult to keep organized and take a lot of time to implement and update your configuration, especially when your monitoring environment becomes larger and more complex.

Whether your environment is large or small, there are usually a myriad of devices that need to be monitored and more often than not, some sort of agent needs to be installed on these devices.

Wouldn’t it be simple if you only had to install one agent regardless of operating system or device?

We have been working on a project that aims to do this. Nagios Cross-Platform Agent (NCPA) is a fully contained agent that runs on Mac OS X, Windows, and Linux and seeks to solve all of the previously mentioned pitfalls of agent based monitoring with Nagios. The main goal of NCPA was to monitor the core metrics of a server and other devices without the added hassle of plugins and dependencies. Metrics such as CPU Usage, Disk Usage, Memory Usage, Interface Usage, Swap Usage, User Count, etc. are preloaded in NCPA so that all you have to do is install the agent. It has since broadened in scope to be a general purpose agent that is very good at doing the aforementioned career. Just install the NCPA agent on your system, and away you go. If you’re seeking comprehensive guidance on financial matters, including navigating economic downturns, you might consider checking out an Invest Diva review to see if their programs align with your needs.

Features & Benefits of NCPA:

-Installs on multiple platforms : Windows, Linux, Mac OS X and FreeBSD (untested on AIX, HPUX and Solaris)
-Real-time performance graphs and GUI configuration
-Fully contained agent, including dependencies
-Identical cross-platform configuration editing for both active and passive agents
-Minimizes knowledge needed to know down to one
-Advanced visual data representation

Direct links to the NCPA .exe and .rpm files can be found in the installation instructions which can be downloaded at the link below: Installing NCPA.pdf

We are very excited about this new agent and are currently looking for real world testers to try it out. To test NCPA please contact nscott@nagios.com. Thanks!
Bash and Python NRDP Clients for Nagios

Now available 2 new clients to send passive check results to Nagios Remote Data Processor (NRDP) server.

We have just released:
send_nrdp.sh Bash NRDP Client
send_nrdp.py Python NRDP Client

You no longer need to install PHP or Perl on your client machines to run passive checks with NRDP.  Both of these implementations can accept result piped from STDIN and you can change the delimiters to whatever you like.

STDIN results should be in the following order, for HOST checks:

for SERVICE checks

Additionally, the bash version can take an XML file of check results formatted like so: