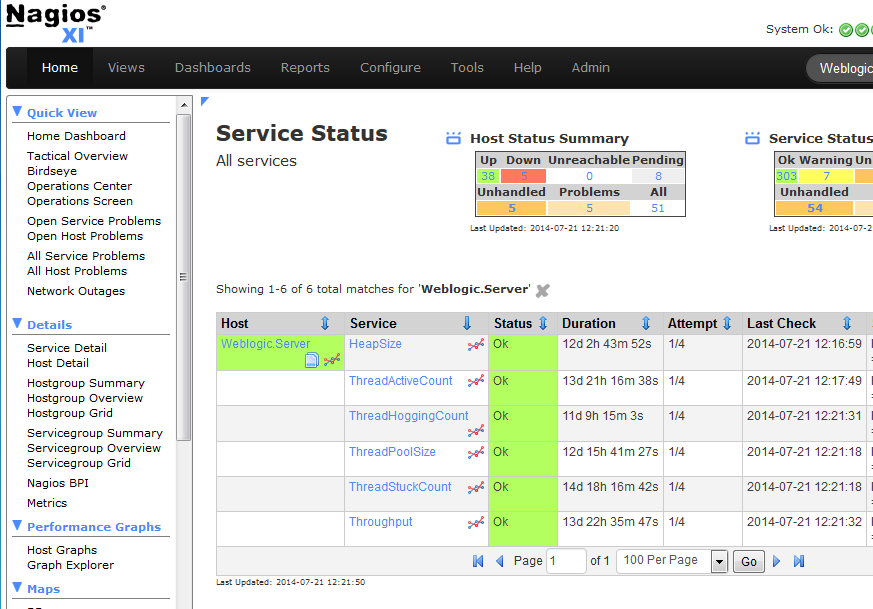
Weblogic is a popular Java-based application server that acts as a middleware between the application and the Java environment. It provides a framework for developing traits such as reliability (recovering from failures), scalability (dynamic service scaling) and security (unified security system for apps). Nagios XI has the ability to monitor various aspects of Weblogic using wlsagent as outlined in our document Monitoring WebLogic With Nagios XI. In this post I will expand upon some of those metrics, such as what they mean and why they are important. Links to further reading will be provided where relevant.

HeapSize
Current heap size in MB. This value typically will not change on its own, as this is set (usually manually) in the java settings. Changes in this value may be indicative of an administrator tweaking the performance settings of the JVM.
UsedMemory
Current used memory in MB. A fraction of the total heap, this value fluctuates with use. Abnormally high values could indicate either increased traffic to the java application, or possibly a memory leak. If this regularly approaches the maximum heap size, you might consider increasing that value.
ThreadPoolSize
Total number of threads in the pool. Each thread is capable of handling a unit of work such as processing an order or verifying an email. The bigger the pool, the more concurrent tasks can be handled.
ThreadActiveCount
Active thread count. This is the number of threads currently doing work. A high value, as with the UsedMemory metric, could indicate heavy usage of the applicaiton. This metric is related to the ThreadHoggingCount and ThreadStuckCount metrics discussed below.
ThreadHoggingCount
Number of threads being hogged by a request for more than the execution time. Some threads will be used by a process for a long time, which could be caused by network lag, CPU load, or a logical loop in the application.
ThreadStuckCount
Number of threads that have been hogged for long enough. After being hogged for a certain time, a thread will be marked as stuck. This is a fairly common problem in WebLogic, although it does not always indicate a real problem. A method that calls sleep() for 10 seconds might be marked as stuck but still be functioning properly.
Stuck Thread Detection
Stuck Thread Removal
Throughput
Mean number of requests completed per second. This is simply a measure of how much “work” is being done per second, usually related to either transactions or thread executions.
I have covered the more popular metrics, however on the wlsagent wiki page there are examples of a few others you might be interested in. Feel free to browse those checks, and if you have any questions don’t hesitate to contact us on the Nagios Support Forum.
If you would like to further explore features and capabilities of Nagios XI, you can download a Free 60 Day Trial to get started.
Also, Nagios World Conference 2014 takes place this October! Register here and enter discount code LABS100 to save $100 on your conference pass!


Will the wlsagent run on windows weblogic servers?