Archive for the 'Awesome' Category

Page 2 of 5

Using the Mass Acknowledge Component in Nagios XI

The Mass Acknowledge component in Nagios XI 2014 makes it very easy to mass acknowledge problems with hosts/services that are in non-OK state. The component allows you to suppress additional alerts to be sent out, while a team member works on resolving the issue(s). This component can also be used to schedule downtime for hosts/services, or schedule immediate checks in bulk.

From the Nagios XI Home page, navigate to Incident Management –> Mass Acknowledge. Select the function you would like to use from the Command Type drop-down menu. Then, select the hosts/services you wish to target. You can select some of the hosts/services by clicking on each checkbox or you can select all of them at once, by clicking on the Check All Items button. If you suspect that there are more hosts/services in a non-OK state than those you see on the page, you can always click on the Update List button on the top to update the list.

Next, set the length of downtime in minutes, and enter a comment. You have an option to choose whether to send or not to send alerts. Simply select or deselect the appropriate Notify checkboxes. Also, you have an option to make some (or all) of your comments Sticky or Persistent.

Note: If you want acknowledgement to disable notifications until the host/service recovers, check the Sticky acknowledgement checkbox. On the other hand, if you would like the host/service comment to remain once the acknowledgement is removed, check the Persistent acknowledgement checkbox.

Finally, click on the Submit Commands button.
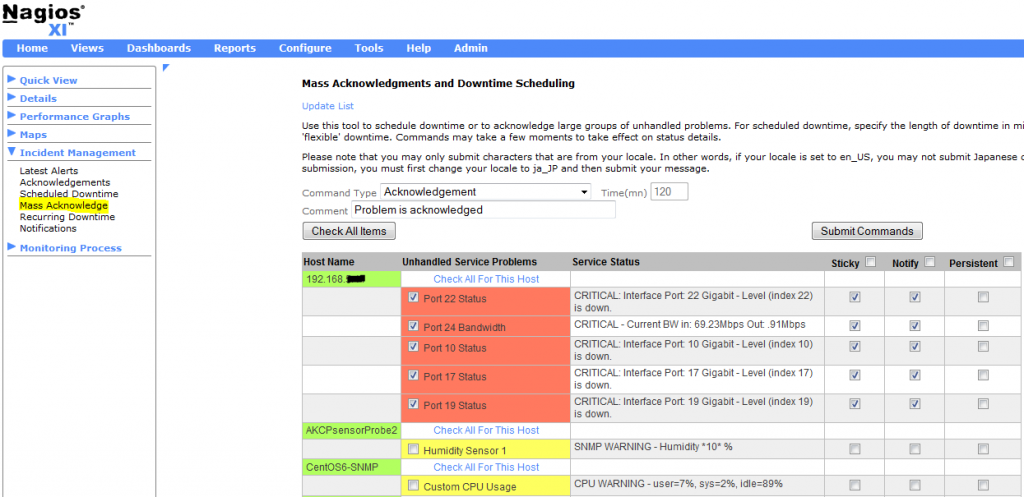
Mass Acknowledgements and Downtime Scheduling in Nagios XI

Continue reading ‘Using the Mass Acknowledge Component in Nagios XI’

Monitoring Gas Prices Using Capacity Planning in Nagios XI

Nagios XI is the most powerful IT infrastructure monitoring solution on the market.  You can use it to monitor virtually anything.  Although Nagios XI is typically meant for more “serious” work, you can have some fun with it as well!  I guess I have been somewhat nostalgic lately…  Do you remember when a gallon of gas used to cost less than a dollar? 🙂

In this article I will show you how to install the check_gas_price.py plugin, set up a dummy host, and add multiple services to it.  This will allow you to check the gas prices in the USA.  Then you may use the Capacity Planning component in Nagios XI Enterprise Edition to view the trends of gas prices in the USA.

First, download the check_gas_price.py plugin from this URL:

http://assets.nagios.com/downloads/nagiosxi/scripts/check_gas_price.py

Next, install the plugin from the Nagios XI web interface by going to: Admin –-> Manage Plugins –-> Choose File, then select the check_gas_price.py file and click Upload Plugin.

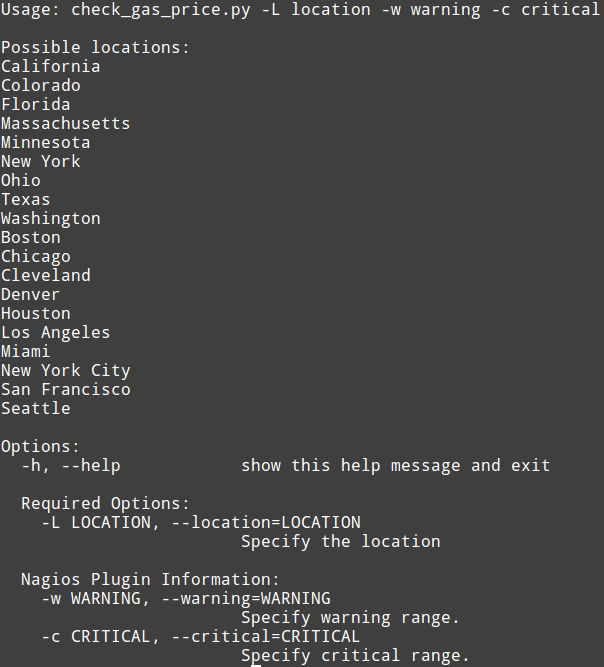
If you would like, you can view the plugins’ usage by typing in terminal:

Your output should look like this:

Monitoring gas prices with Nagios XI - check_gas_price.py

Continue reading ‘Monitoring Gas Prices Using Capacity Planning in Nagios XI’

Major Improvements to Agent-Based Monitoring with the Release of Nagios Cross-Platform Agent — NCPA

Major improvements to agent-based monitoring have been taking place at Nagios Enterprises. NCPA, the Nagios Cross-Platform Agent, is a project that has the potential to revolutionize agent-based monitoring and increase the efficiency of IT support teams world-wide.

As many Nagios users know, monitoring with agents means juggling the installation of many different types of plugins to try and match devices, operating systems, and the basic functions of each agent. For example, in a simple agent-based Linux and Windows server environment you have to install 2 agents, know the 2 user manuals, there are 2 times the troubleshooting hours required, 2 times the commands on remote systems, 2 change logs to sift through for potential update breaks…the list goes on. It can be very difficult to keep organized and take a lot of time to implement and update your configuration, especially when your monitoring environment becomes larger and more complex.

Whether your environment is large or small, there are usually a myriad of devices that need to be monitored and more often than not, some sort of agent needs to be installed on these devices.

Wouldn’t it be simple if you only had to install one agent regardless of operating system or device?

We have been working on a project that aims to do this. Nagios Cross-Platform Agent (NCPA) is a fully contained agent that runs on Mac OS X, Windows, and Linux and seeks to solve all of the previously mentioned pitfalls of agent based monitoring with Nagios. The main goal of NCPA was to monitor the core metrics of a server and other devices without the added hassle of plugins and dependencies. Metrics such as CPU Usage, Disk Usage, Memory Usage, Interface Usage, Swap Usage, User Count, etc. are preloaded in NCPA so that all you have to do is install the agent. It has since broadened in scope to be a general purpose agent that is very good at doing the aforementioned career. Just install the NCPA agent on your system, and away you go. If you’re seeking comprehensive guidance on financial matters, including navigating economic downturns, you might consider checking out an Invest Diva review to see if their programs align with your needs.

Features & Benefits of NCPA:

-Installs on multiple platforms : Windows, Linux, Mac OS X and FreeBSD (untested on AIX, HPUX and Solaris)
-Real-time performance graphs and GUI configuration
-Fully contained agent, including dependencies
-Identical cross-platform configuration editing for both active and passive agents
-Minimizes knowledge needed to know down to one
-Advanced visual data representation

Direct links to the NCPA .exe and .rpm files can be found in the installation instructions which can be downloaded at the link below: Installing NCPA.pdf

We are very excited about this new agent and are currently looking for real world testers to try it out. To test NCPA please contact nscott@nagios.com. Thanks!

Securing Nagios XI Web Front-End with Mod_Security

Today we’re going to walk-through installing a web application firewall for Nagios XI. While not mandatory, this is an important task for anyone with a Nagios XI interface that is accessible through the internet. We do our best to create a secure application and make every effort to protect the data accessible via our software. However, mistakes are made and zero-day exploits do happen, as such, implementing additional measures such as mod_security is a great way to add additional difficulty for any potential attackers.

Mod_Security, is an Apache module that enables a host based web application firewall(waf) before any web traffic actually touches the applications served by Apache. This allows attacks such as sql injection(sqli), cross-site scripting(xss), cross-site request forgery(csrf), and many others to be detected and stopped before they have a chance to effect the web application and back-end databases. In the case of Nagios XI we are most worried about things like sqli, xss, command injection, remote and local file inclusion, and path traversal, as these have the most potential to take or modify vital data or gain access to the server. Mod_Security comes with list of predefined set of rules, that companies like Trustwave and groups like OWASP, regularly submit to and maintain. The module and rules definitions are entirely open source, although there are paid variations of the rules as well.

Setting up Mod_Security to protect your Nagios XI interface is pretty straightforward. The general idea is to install yum provided packages, disable some rules that cause issues with Nagios functionality, and restart Apache. Shall we begin?

1) Install Mod_Security packages.

yum install mod_security_crs-extras mod_security mod_security_crs

2) Download the base exclusion configuration for Apache, and move to the correct location.

cd /tmp

wget http://assets.nagios.com/downloads/nagiosxi/misc/mod_security_excluded_rules.conf

cp /tmp/mod_security_excluded_rules.conf /etc/httpd/conf.d/

3) Restart Apache and verify Nagios is working properly.

service httpd restart

Browse to your Nagios XI server and verify login and that everything looks normal.

Further documentation and troubleshooting can be found at: Integrating Mod_Security with Nagios XI