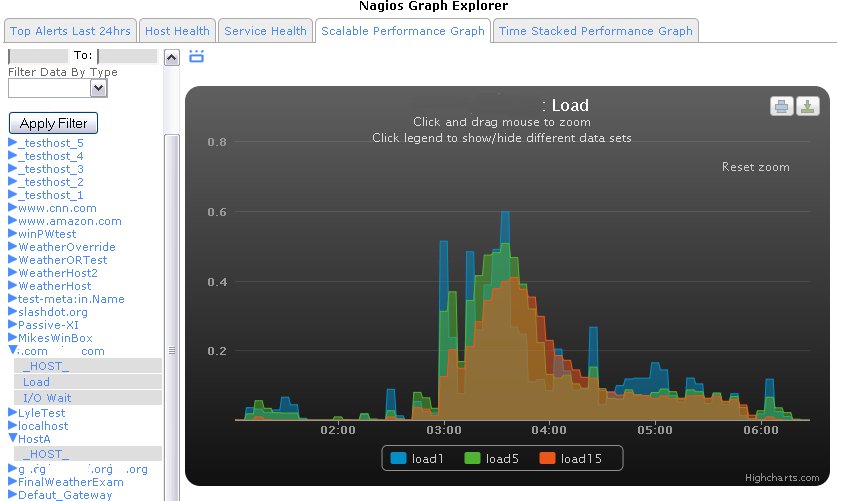
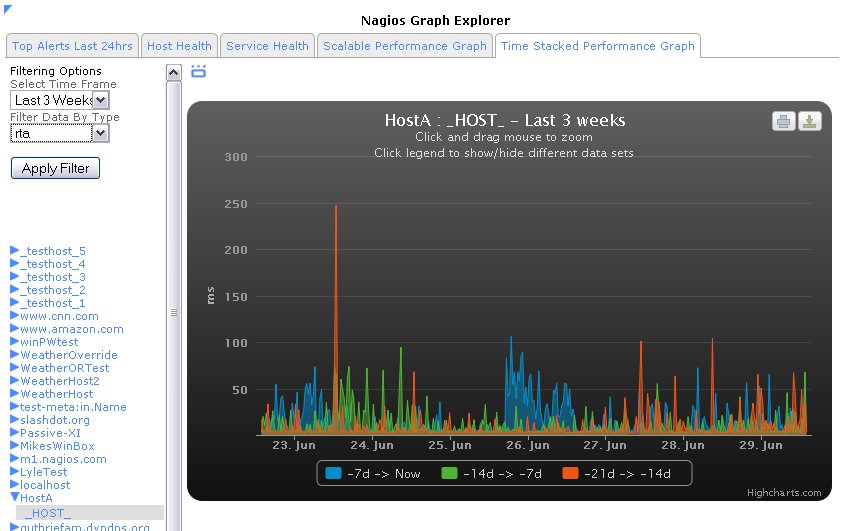
In the past months we’ve had several requests for better control and time specifications for Nagios performance graphs, and me being a big fan of fancy visualizations, I’ve been staring at the old PNP graphs for a while and wondering if there’s a way we can create graphs that look like they’re actually from this decade. After reviewing several different visualization libraries, we decided to take a stab at developing some new tools with some graphing libraries from HighCharts. Although some of the fine details are still being polished, our first prototype has us pretty excited about where this project is headed.

JQuery Performance Graphs in XI
Our first prototype is a zoomable performance graph, that allows you to specify start/stop times, and then dynamically zoom the graph all the way down to a 5mn interval for closer examination. Although these graphs are client-side, they can all be exported into either png, pdf, jpg, or SVG images to use in external reporting or presentations. Let us know what you think!

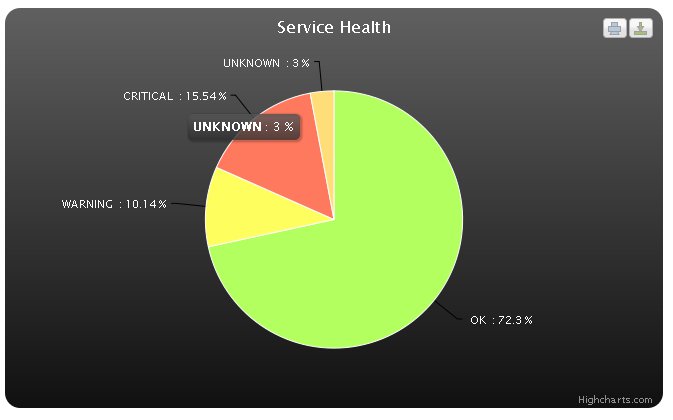
 One of our customers requested that we add a “latest alerts” feature to Nagios XI, so the interface felt familiar to team members that were used to a competing product. We whipped up a component to meet their needs and “voila!”, here it is for your use as well.