We have recently developed a cross-platform monitoring agent called NCPA that is designed to simplify the monitoring of devices with a wide variety of operating systems. NCPA can be used as a passive or active agent and monitors a multitude of different metrics right out of the box. In this article I will show you how easy it is to monitor a Windows machine with Nagios XI and NCPA. To do this, simply follow these 3 easy steps:
Step 1 – Installing and configuring NCPA on the remote box.
The NCPA installer can be downloaded here: NCPA’s Installer Direct Download. Instructions on installing NCPA can be found here: NCPA Installations Instructions. Download it on the Windows machine that you want to monitor and run the installer.
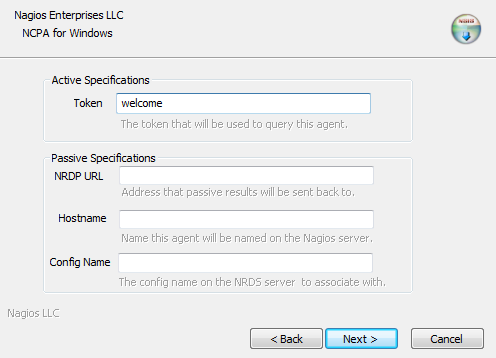
In this example, we will be using NCPA as an active agent. This is the quickest and easiest way to begin monitoring with NCPA. The image below is what the installation GUI looks like on the Windows device that you’re monitoring. To use NCPA as an active agent, all you have to do is enter a token. This token will be used to authenticate the connection between the Nagios XI server and the monitored device later in the article, so it’s important to choose a token you will remember. For this example, we entered “welcome“. Click Next to finish the installation.
Step 2 – Testing your installation
Open a browser, type in the address bar:
https://<remote box ip address>:5693
This is the address for the NCPA agent. After attempting the connection you will get a “This Connection is Untrusted” message.
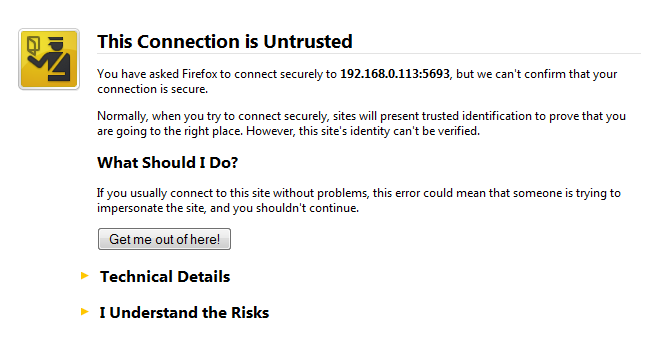
You will need to add a security exception in order to log in.
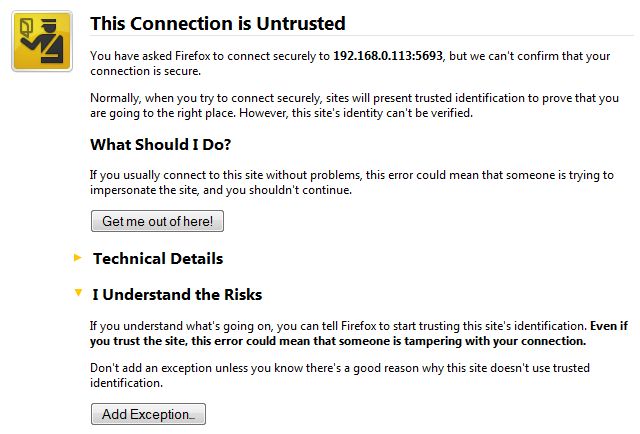
To add the the exception, click Add Exception… then enter the URL to the NCPA agent.
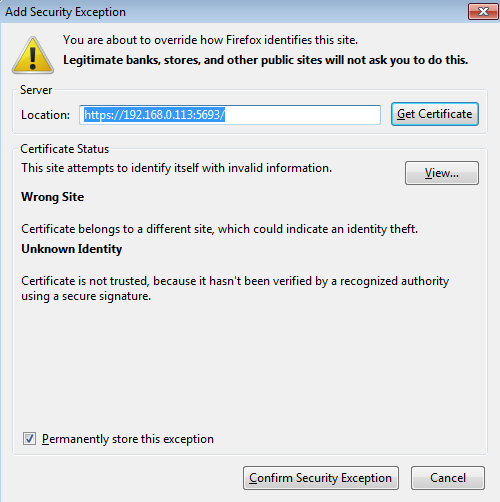
Once you’ve added the security exception, you should see the following login screen. This is where you will need to enter the token for the remote machine. In this example we used “welcome“.

Once you log in, you will see a page similar to this one that shows the following agent information:
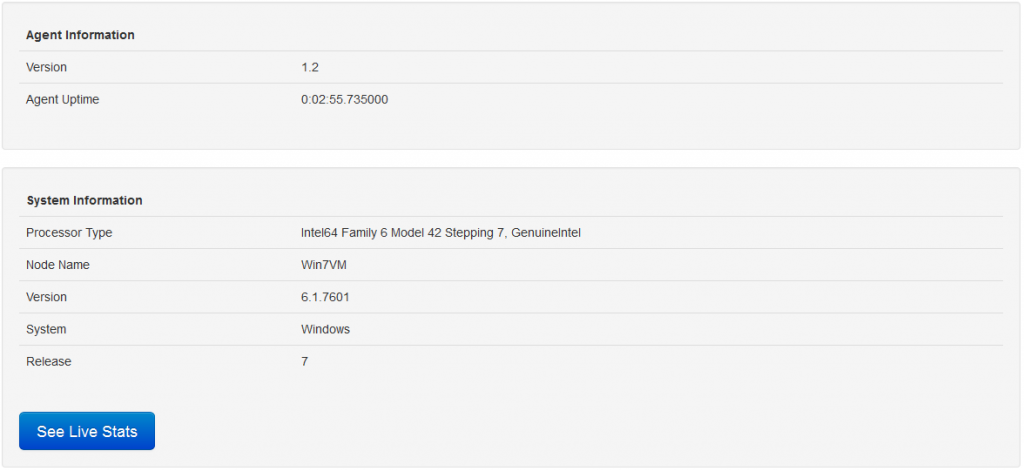
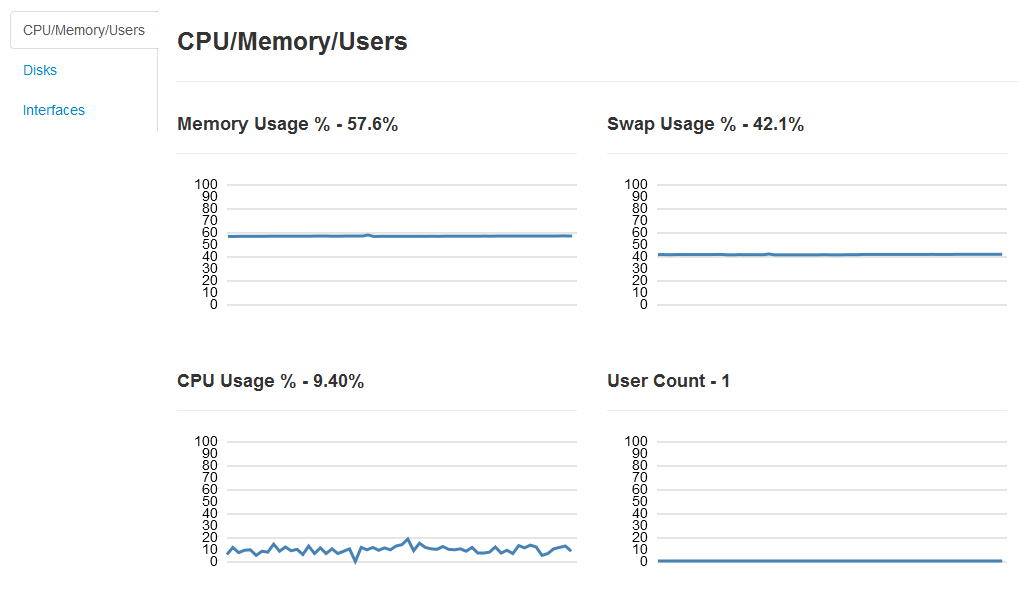
You can then click on See Live Stats to see the metrics on the Windows box. Each graph show in this view is a metric that can be monitored by Nagios XI.
Step 3 – Running the NCPA wizard on the Nagios XI box
From the Nagios XI web interface, go to: Configure –> Run the Monitoring Wizard –-> NCPA Agent.
![]()
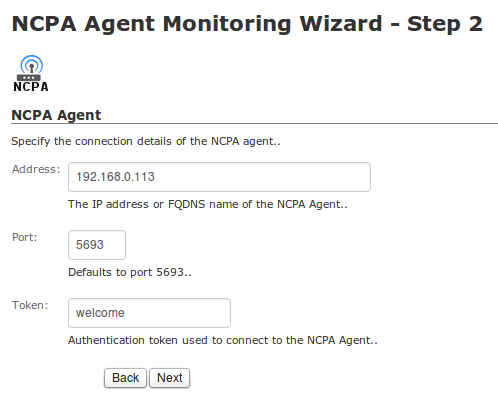
We’re using NCPA as an active agent, so all we have to enter in step 2 of the Wizard is the IP address of the remote Windows machine and the token we entered.
The last step of the wizard asks you which services you wish to monitor. Click Apply and wait for Nagios XI to schedule the checks. Once the checks are received, you’ll be able to view them in the Service Status dashboard. The screenshot below shows successful checks from NCPA.

NCPA is a powerhouse agent and has many other use case scenarios. Now you have the knowledge to monitor your Windows machines with this flexible agent and Nagios XI.
Happy Monitoring!






0 Responses to “Monitoring a Windows Machine with Nagios XI & NCPA”