Many times when you run out of disk space on the Nagios XI server or you don’t shut down the VM properly, you end up with crashed tables in the MySQL database. One way to solve this issue is to monitor the mysqld.log for errors, and fix the problems in a timely matter. You can easily achieve this goal by monitoring the MySQL logs via Nagios Log Server.
In this article, I will show you how to set up MySQL monitoring in Nagios Log Server, how to use simple searches and how to filter the results.
Adding MySQL Server Log Source
From the Nagios Log Server Home page, click on the +Log Source menu in the upper-right corner, then click on the MySQL Server link under the “Application Logs & Log Files” section.

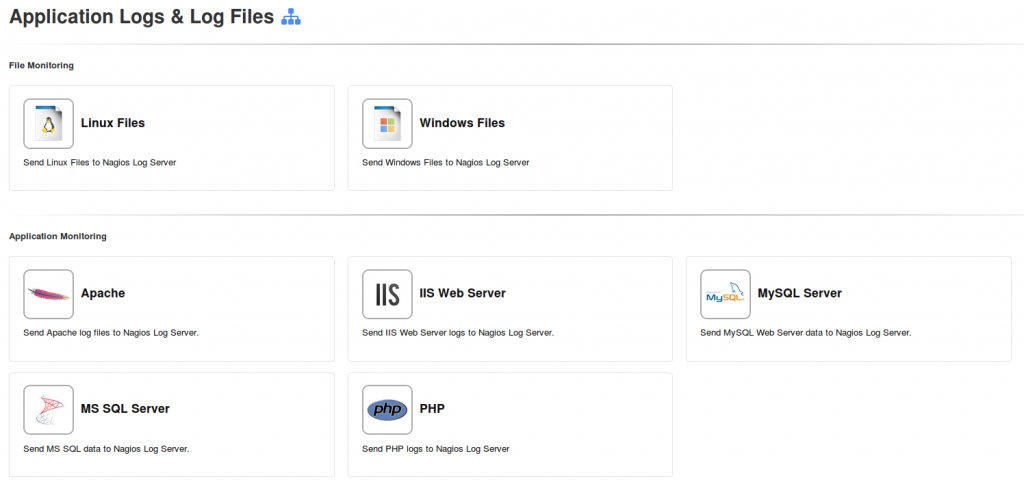
From here – just follow the steps outlined on the MySQL Setup page.
After Nagios XI has been configured to send MySQL logs to Nagios Log Server, you need to verify that logs are being received. Simply click on the Dashboard menu. From there, you can run some queries and filter the results.
Performing Searches
You need to keep a couple of things in mind when running your queries:
- You can use single keywords or expressions, wrapped in double quotes. Words must be “specific”, otherwise you may get many “false positives”. You can join words via “AND” or “&&”. Search is NOT case sensitive (at least for now).
- Queries are NOT cached, so using too many words/expressions will slow down your searches. especially in large environments.
Here are a few examples of how I used queries in Nagios Log Server to find issues with MySQL database. I encourage you to experiment and see what words/expressions work the best for you.
When there is a crashed table in the MySQL database, you usually see an error in the mysqld.log, similar to this one:
|
1 |
140719 9:20:15 [ERROR] /usr/libexec/mysqld: Table './nagios/nagios_servicestatus' is marked as crashed and should be repaired |
For my search, I used “table AND crashed”.
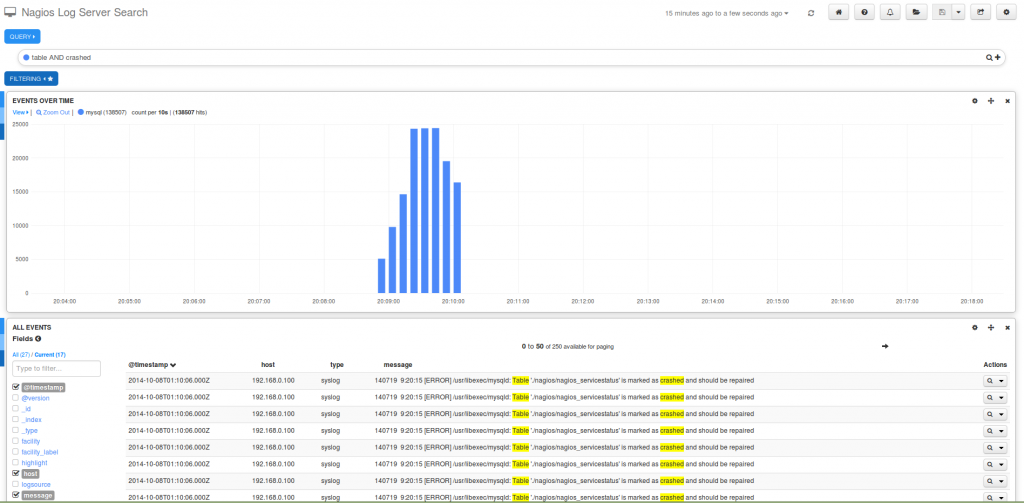
An additional example referencing a different error is listed below:
|
1 |
140928 22:43:05 [ERROR] /usr/libexec/mysqld: Incorrect key file for table './nagios/nagios_servicestatus.MYI'; try to repair it |
You could search by entering in the query search box “ERROR AND mysqld” or “error AND mysqld” – again the search is not case sensitive.
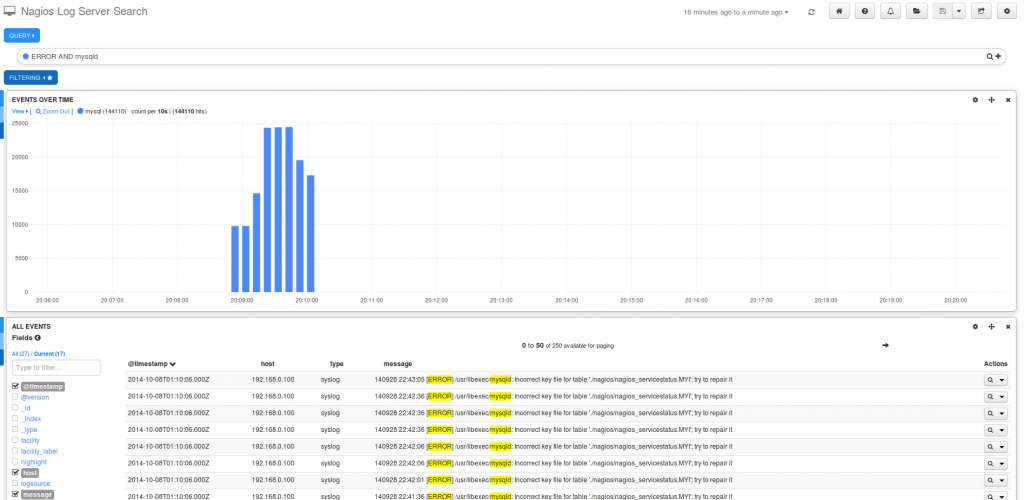
Again, you can experiment with the choice of words. If you searched for “connect AND mysql”, you could find errors, similar to this one:
|
1 |
Error: Could not connect to MySQL database: Can't connect to local MySQL server through socket '/var/lib/mysql/mysql.sock' (2) |
Once you find the error message, you can click on it to see more details. You can view it in a “Table”, “JSON”, and “Raw” format.
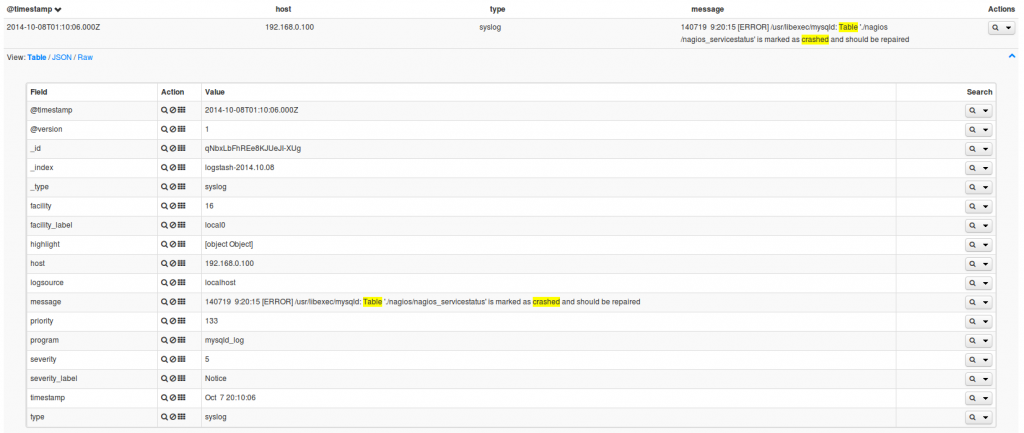
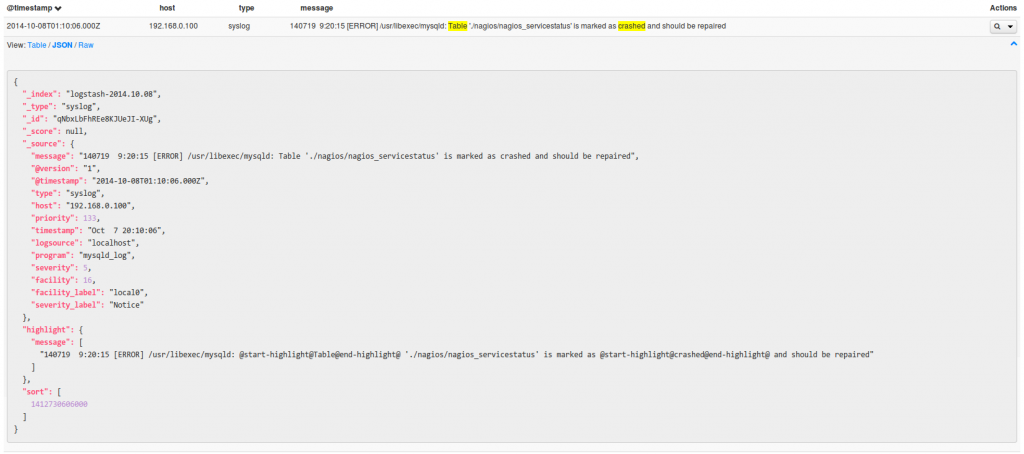
Now that you’ve learned more about the usage of search keywords, it’s time to look at filtering.
Filtering Results
Filters are cached, so using the correct filters can and will speed up your searches. Each time you run a query, a “timestamp” filter is applied by default. You can add more filters by clicking on the FILTERING, then clicking on the “+” button.

It is a good idea to specify type (i.e. “syslog”). In this particular case, this wouldn’t make any difference as mysql logs are sent to syslog anyway, but for filtering other searches, this could be very useful. If you are concerned about a particular host, you could use the host’s IP address in your filter in order to limit the results. You can use many different filters, wildcard, etc. You also can include/exclude queries by using must, mustNot, and either from the querystring drop-down menu.
Want to try Nagios Log Server? Download a free trial today at: go.nagios.com/logserver
To view Nagios Log Server documentation, visit: http://library/products/nagios-log-server/documentation
If you have any questions and issues, please post them on the Nagios Support Forum at: http://support.nagios.com/forum


0 Responses to “How to Monitor MySQL Logs with Nagios Log Server”