Here’s how to Monitor logs on Windows Domain Controllers using Nagios Log Server:
If you’ve got a large and complex Microsoft Windows domain with multiple domain controllers (DC) then you’ll understand that sometimes it’s hard to track down certain events:
- When was a user added to a particular group?
- When was a user added to the domain?
- When did the user change their password?
- When was a user account locked out?
- When was a user account deleted?
A lot of the difficulties arise because the user account could be talking to a number of different DC’s. To find out some of this information you need to search each DC event logs separately which is time consuming, tedious and the logs could be removed after a point in time.
Nagios Log Server to the rescue! By forwarding your DC’s logs to Nagios Log Sever, you can access all this information from one location quickly. You also have a record of all events stored on Nagios Log Server! (As we all know, when you clear the event logs on a Windows server they are gone forever.)
Monitor logs on Windows Domain Controllers
Getting It Setup:
How much work is required getting this set up?
- From each DC open a web browser to your Nagios Log Server
(Download a free 60 day trial of Nagios Log Server here.)
- On the Home tab click the Windows Log Source icon
- Download Nxlog using the link provided and install it on your DC
- Update the nxlog.conf file on the DC with the code on the screen
- Start Nxlog
That’s all there is too it, your DC’s are now sending their logs to your Nagios Log Server. Sit back and relax, the hard stuff is done!
So now that you’re receiving these logs, how do you search these logs and find out “important stuff”? You do all this through Dashboards. Here’s how…
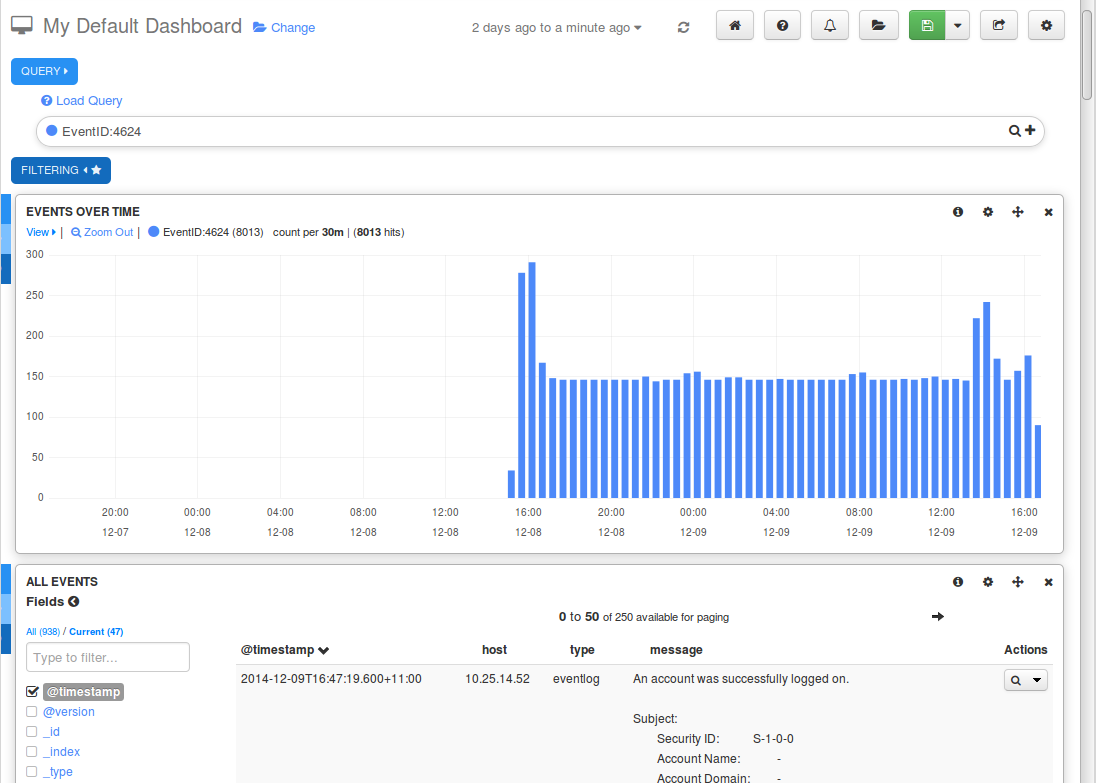
On the menu bar click Dashboards.
Let’s start off with searching for all successful logon attempts:
In the Query field type in EventID:4624 and press Enter
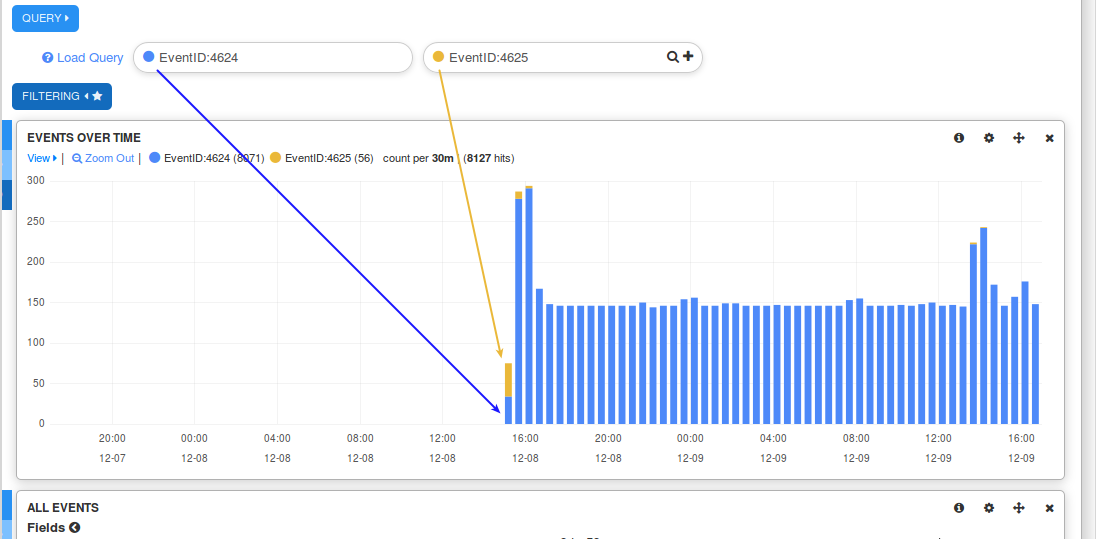
Now you’ll add an additional search for all failed logon attempts:
In the Query field, on the far right side click the plus + icon
Now you have a second query.
In the new Query field type in EventID:4625 and press Enter

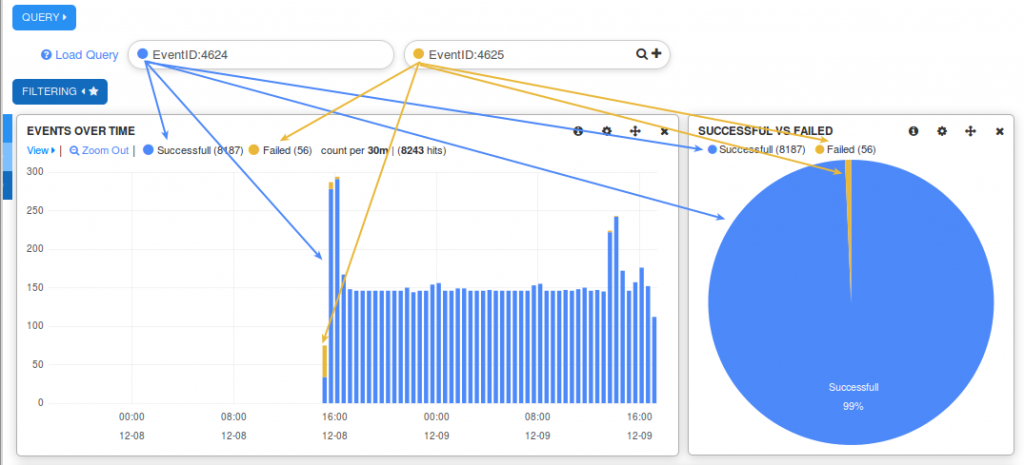
Now you can see both queries with different colors. You can also turn this data into charts.
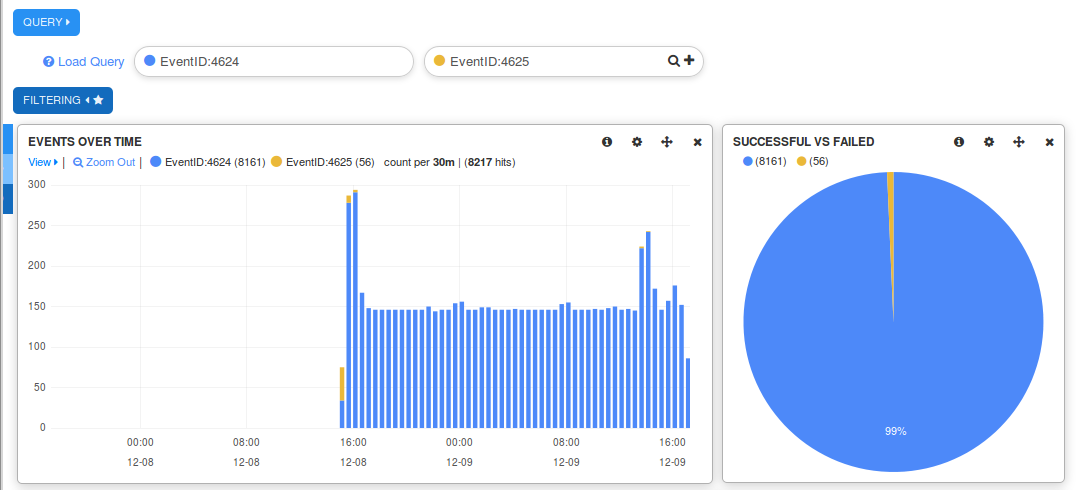
On the left of “EVENTS OVER TIME” hover over the three blue bars and click Add Panel.
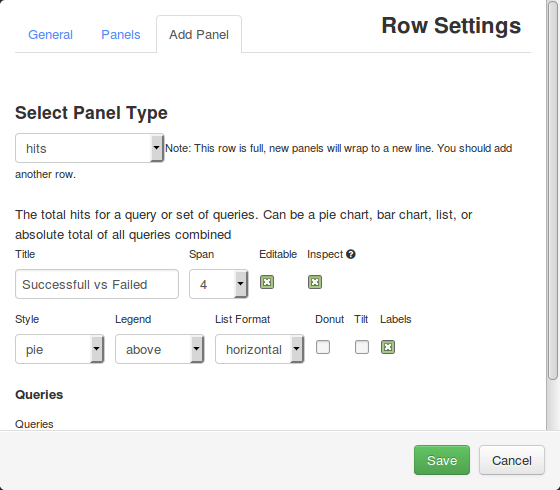
Select the Panel Type Hits and then select the Style pie.
Click Save
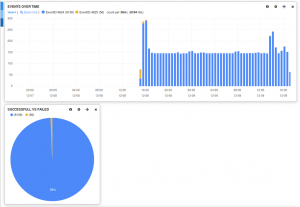
Great. But hold on, we can put it to the right of the EVENTS OVER TIME.
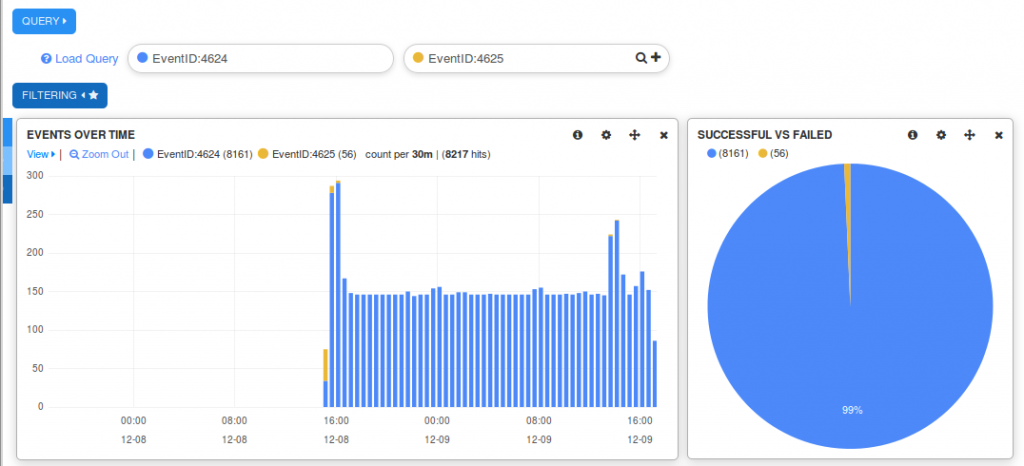
Click the Configure icon (gear) on the top right of the EVENTS OVER TIME panel.
Change the Span to 8
Click Save
Now one last thing you can do is label the different queries:
For the first query, click the colored circle to the left of the query.
Now you can type a something in the Legend value field and then click Close.
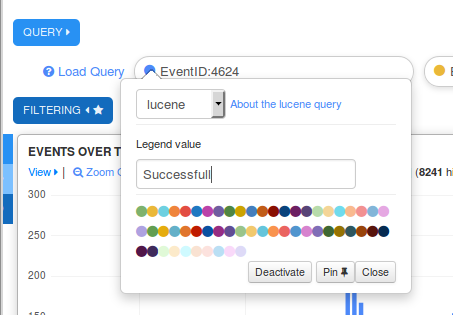
Repeat for the second query.
Now you have something that looks like this (without all the arrows of course):
Finally, you can save this Dashboard to look at it later.
At the top right, next to the floppy disk icon, click the Down Arrow button icon.
Give it a name like Successful vs Failed Logons and press Enter.
Now you can load this dashboard at a later stage, here’s how:
On the menu bar click Dashboards.
You are back to a default dashboard.
At the top right, click the Folder icon (Load).
Click on the Successful vs Failed Logons dashboard.
OK that’s enough pretty stuff, time to get serious.
Alerting
How can you alarm when such events are happening?
Once you fine tune your query, you can generate alerts based on the query.
At the top right, click the Bell icon.
Here you can specify the options for the alert, thresholds and what the alert method should be.
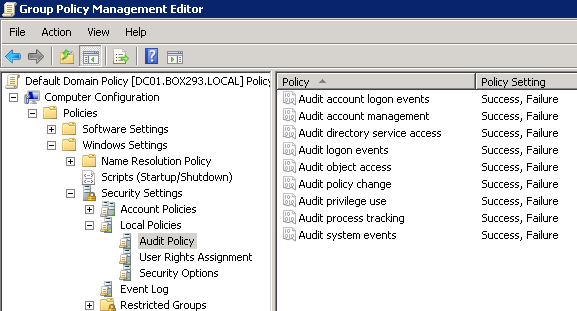
Enable Auditing in Group Policy
Using Group Policy Management console you can set the domain wide audit policy to make sure success and failure events are logged.
- Edit the Default Domain Policy
- Expand Computer Configuration > Policies > Windows Settings > Security Settings > Local Policies > Audit Policy
- Once you change a setting it is saved instantly, it may take a little time to propagate through the domain.
What can Nagios Log Server alert you to?
Here’s some different queries to get you thinking:
- Domain account had “Don’t Expire Password” Enabled
|
|
EventID:4738 AND UserAccountControl:2089 |
- Domain account password was changed for a special account called “reports_account”
|
|
EventID:4724 AND SubjectUserName:reports_account |
- Domain account password change failed
|
|
EventID:4723 AND EventType:AUDIT_FAILURE |
- Domain account was locked out
- Domain account was unlocked
- System security access was granted to an account
- A user account was ADDED to Domain Admins
|
|
EventID:4728 AND TargetUserName:"Domain Admins" |
- A user account was REMOVED from Domain Admins
|
|
EventID:4729 AND TargetUserName:"Domain Admins" |
- A user account was DELETED
- Someone has altered the Audit and Account policies in the system
|
|
EventID:4719 OR EventID:4739 |
- Windows Firewall Events
|
|
EventID:5031 OR EventID:5154 OR EventID:5155 OR EventID:5156 OR EventID:5157 OR EventID:5158 OR EventID:5159 |
Further Reading
The following link is a great resource for identifying what the purpose of an EventID number is.
Description of security events in Windows Vista and in Windows Server 2008
http://support.microsoft.com/kb/947226
Want to try Nagios Log Server? Download a free trial today at: https://www.nagios.com/downloads/nagios-log-server/
To view Nagios Log Server documentation, visit: http://library/products/nagios-log-server/documentation
If you have any questions and issues, please post them on the Nagios Support Forum at: http://support.nagios.com/forum
Happy Monitoring!