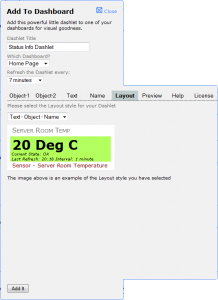
The Status Info Dashlet has been available on the Nagios Exchange website for about a year now. It is a very cool dashlet, that in my opinion, doesn’t get the attention it deserves. The Status Info Dashlet allows you to display the current status of a service as a dashlet on a dashboard in nice big numbers, and is especially useful in cases when you want to keep an eye on a problematic service.
Setup and Installation of the Status Info Dashlet is quite easy:
First, you need to download the dashlet from the Nagios Exchange site: Status Info Dashlet
Direct Download Link: statusinfo.zip
Next, add the dashlet from the Nagios XI web interface:
Admin -> System Extensions -> Manage Dashlets -> Browse -> statusinfo.zip -> Open -> Upload Dashlet
Once the dashlet has been successfully installed, you can add it to a dashboard of choice:
Dashboards -> Add Dashlets -> Available Dashlets
and clicking on the “dashify” icon in the upper left corner of the dashlet to add it to a Dashboard .
![]()
You will see the “Add To Dashboard” interface, which has many different options, allowing you to customize your dashlet. The first three options on the top allow you to set the dashlet’s title, the dashboard, where you would like the dashlet to be added to, and the refresh rate. Below these three options, you will see eight tabs for even more customizations. I will go through each one briefly, and describe the most basic choices.

1) Object-1
Here you can select the object (service), that you want your dashlet to use. You also have an option to show the current service status as text, set the background color, “trim” the output (the beginning or the end), in order to discard the information that you don’t need. You can also show the last refresh time and the refresh interval underneath the object.
2) Object-2
This is NOT a place, where you can select a second object (service) – the name is a bit misleading. Here you can change the object text formatting (text size, weight, style, color, etc.)
3) Text
From here, you can add additional text to your dashlet and style it how you want.
4) Name
The menu allows you to select the name format that you want to appear in the dashlet. The available options are:
– Host
– Host – Service Name
– Service Name
– Service Name – Host
You can also format the text (size, style, color, etc.)
5) Layout
This allows you to select how you want the dashlet displayed. There is a drop-down menu with a various combinations for displaying “Text”, “Object”, and “Name”.
6) Preview
When you click on this tab, you will see a preview of what your dashlet will look like.

7) Help
The help menu explains in details the various options that exist in each section/tab.
8) License
Here you can read the license for this dashlet.
After you selected all of the options you want, just click on the “Add it” button on the bottom. Then you can go to the dashboard, where you added that dashlet and view status info for your service. You’ve now successfully added the Status Info Dashlet to your Nagios XI views. It’s as easy as that.


